Never a surprise at how quickly things can turn in the stock markets. Just yesterday, the S&P 500 closed into new record highs. Overnight and into this morning, we gave up everything. Under technical tactics, I will explain with the charts why this sell off may not just be over.
But first we have a slew of data to look at. Firstly yesterday we had the Fed minutes from their last meeting. This was highly anticipated due to Powell’s comments on the Fed members “talking about thinking of tapering”. The market wanted to see whether these Fed minutes would divulge the Fed’s path to raising rates sooner rather than later. This is the important part of the minutes:
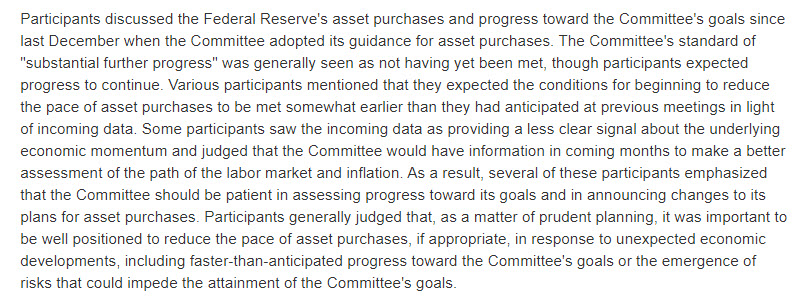
Media headlines read “FOMC Minutes Show Fed Ready to Taper Earlier than Anticipated” . This leads to the taper tantrum many are warning about…including Billionaire hedge fund managers. But as I said earlier, markets actually closed higher yesterday AFTER the FOMC minutes. Clearly not buying this talk of rate hikes from the Fed. Another market has been telling us the same. But more on that later.
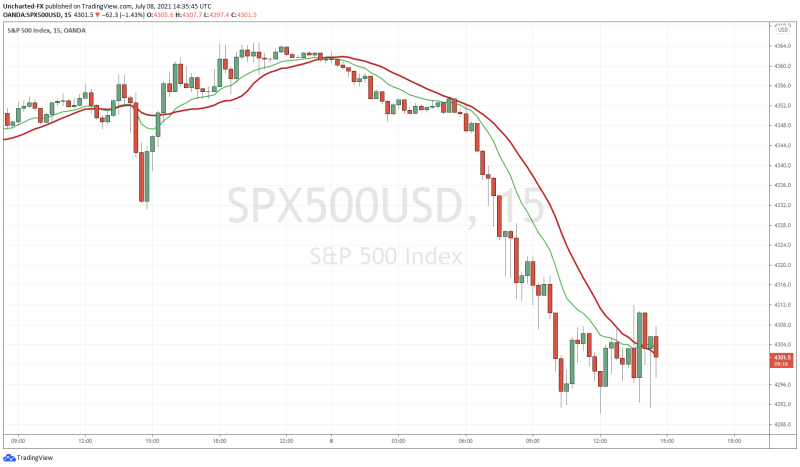
Two more news pieces affected the markets today. Both of them being bad news. US Jobless claims unexpectedly ticked higher (373,000 vs 350,000 expected) raising some doubts on rapid job growth for 2021.
We then heard more news on Covid. Japan has declared another state of emergency and will ban spectators from the Olympic games this year. It is not only Japan, but Australia, South Africa and other Asian nations imposing lockdowns and curfews again. Medical professionals have said we will be fine due to high vaccination rates, but it seems they have flip flopped. CNBC putting out a piece saying what we are seeing in those nations is something we should expect in Fall. High vaccination rates and warm weather has just bought us some extra time.
Lot of fear and the stock markets don’t like it. But what if I told you big money was providing us with signs that all this was coming weeks ago? Enter the Bond Market.
On Tuesday, I wrote a piece explaining why deflation rather than inflation might be the real threat. In the article, I mentioned how the TLT chart is the most important macro chart going forward. After today, we can build up the story. As I have said many times in the past, technicals tend to predict events in this world of imperfect information.
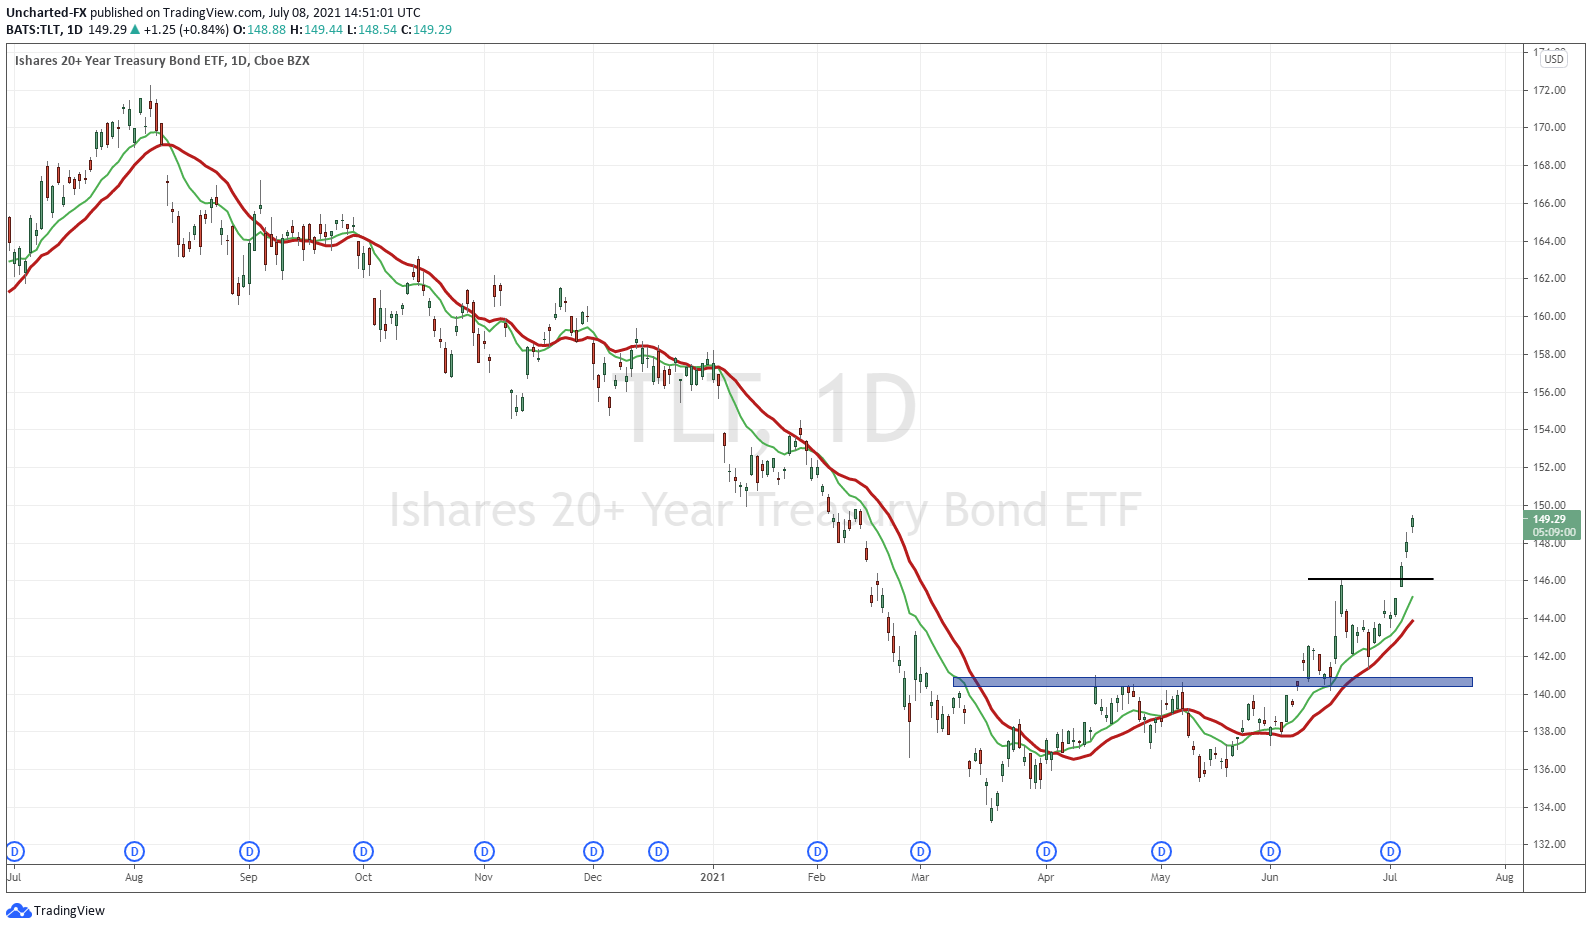
When bond prices go up, in means yields are going down. This is occurring at a time when the Fed is telling us they will RAISE interest rates. The Bond market is telling us something entirely different.
Another way to look at the Bond market is through the lens of asset allocation. Bonds are seen as a risk off asset. Basically meaning when there is fear, you run into Bonds (and the US Dollar). Covid variant headlines could be spooking investors hence the run into Bonds.
But I think the most important way to view the Bond market is expectations for future growth (hence rising or declining yields). The Bond market is telling us that the economic recovery is going to be bumpy. It is pricing in slower growth…or if you are a perma bear, an economic crash.
So why pay attention to Bonds? It is the largest market. But the important thing is that the smart and big money play it. The average investor/retail trader generally play the stock market, forex and/or crypto’s. Bond market just moves too slow (but this might not be the case going forward). Big money has been pricing lower rates and slower economic growth. In my recent article, I argue it is telling us deflation is coming.
Technical Tactics
At time of writing, the major indices are still holding their intraday ranges. As a trader, and over on Equity Guru’s Free Discord Channel, we are just waiting for the break in either direction. I like to focus on longer term charts, and the S&P 500 is the one I am worried about.
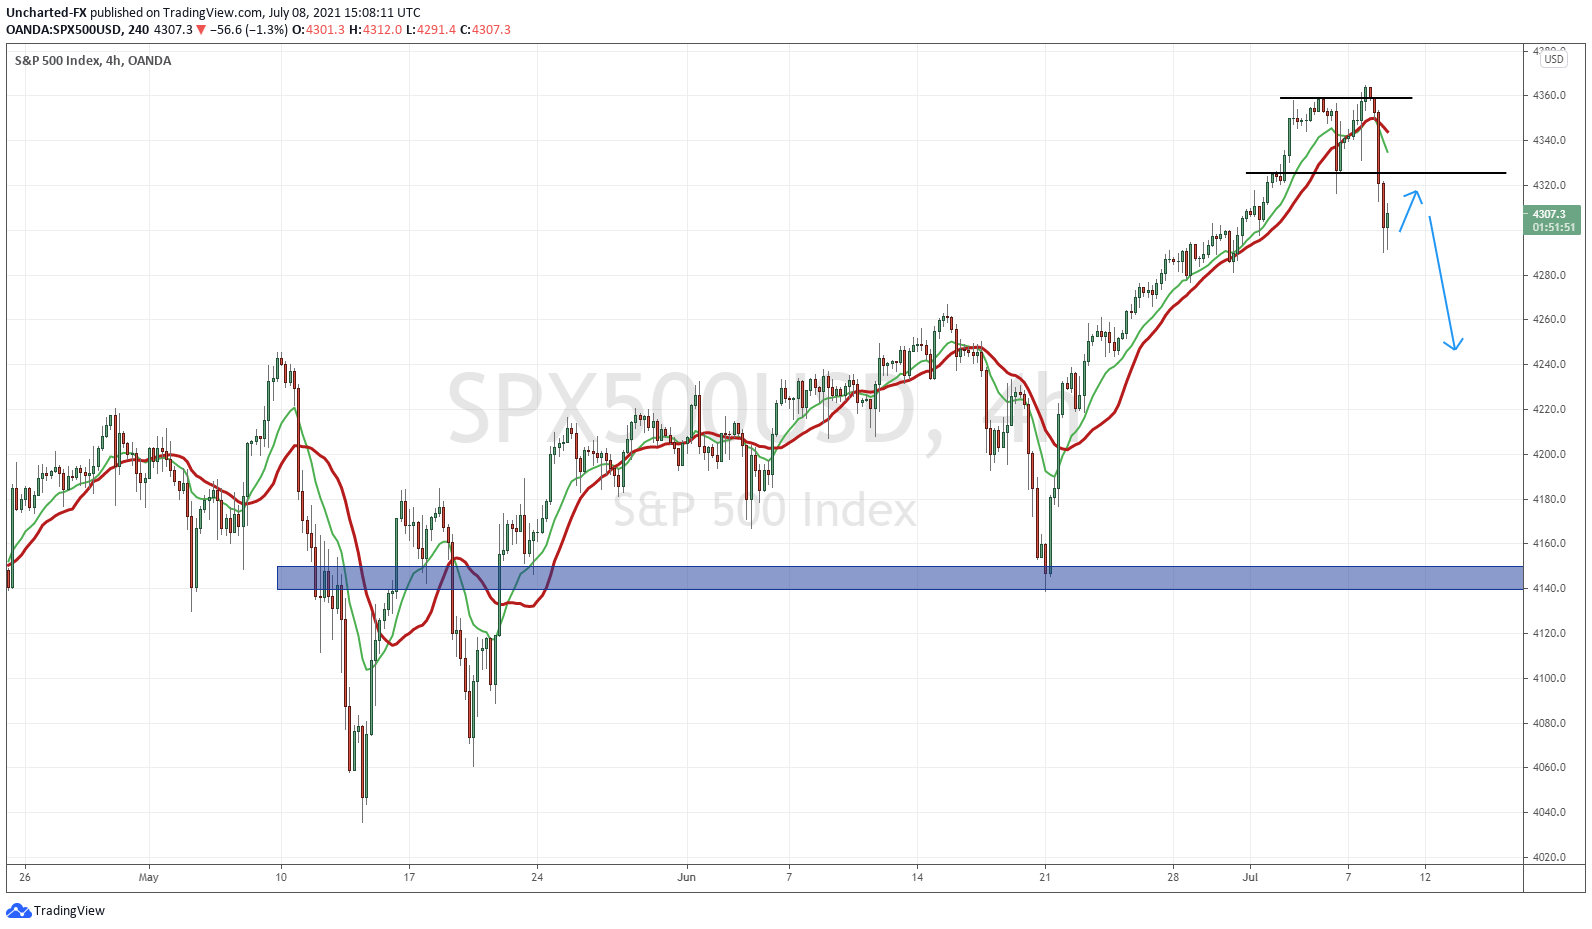
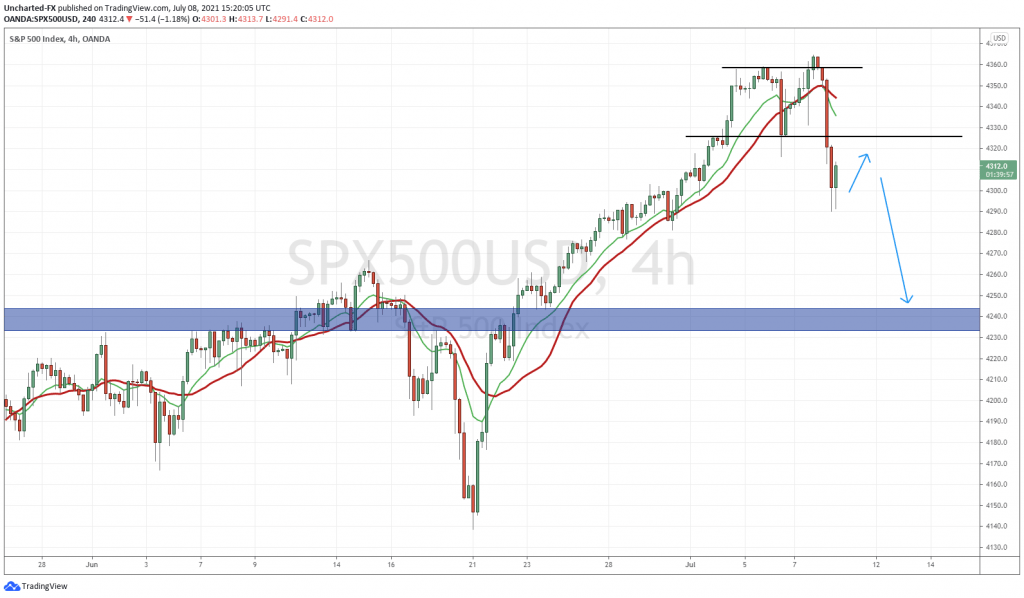
Even though the S&P 500 made new highs, and it looked like we would shoot higher on momentum, the opposite happened. In fact, we broke below a major support at 4325…and triggered a double top pattern. So how am I playing this? Intraday, I think we can move higher on the range breakout. But I expect to see resistance on the retest of the 4 hour chart at 4325. If we close above this, then the downside move is nullified as the double top breakdown becomes a fake out.
My projection of a retest and a leg lower is drawn on the chart. We basically pullback to retest 4250, and to me just normal as it retests a previous daily breakout zone.
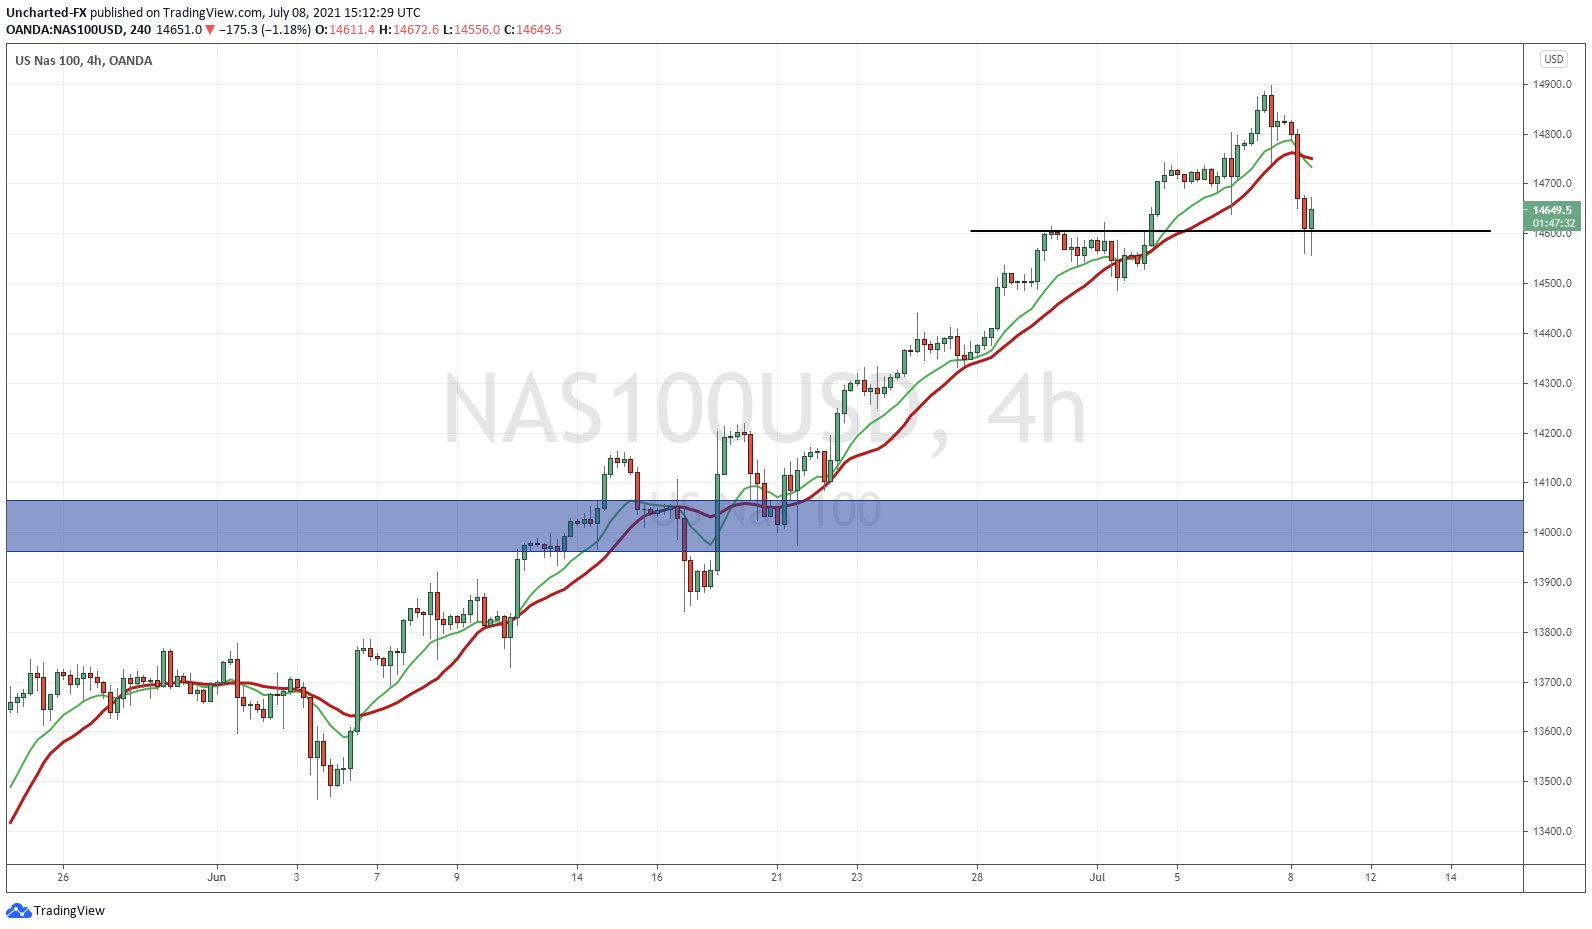
The Nasdaq is actually testing an interim support zone. Buyers are coming in. The wicks on the current and previous candle indicate this. I want to see the Nasdaq close above 14700 before I begin buying.
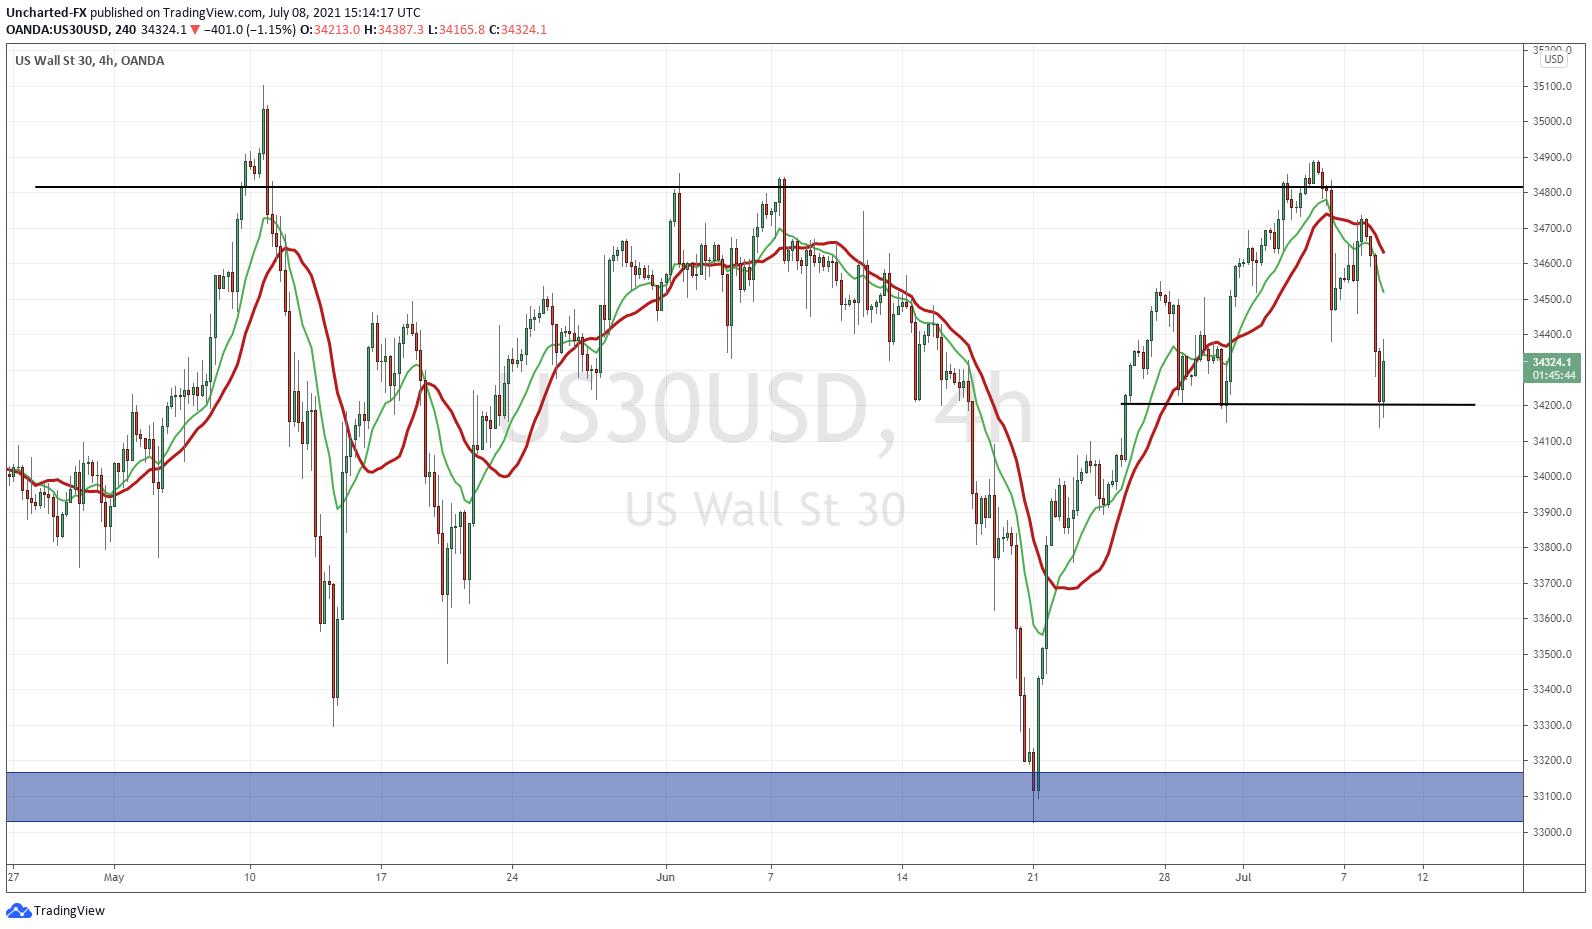
Finally the Dow, which is in the same boat technically as the Nasdaq. It is testing a major support zone. Some of my readers might see what I am thinking. Maybe we develop a right shoulder and print a broader head and shoulders pattern. Whatever the case, 34200 is a big support zone. We are battling here currently. To flip bullish on the Dow, I want to see a close back above 34,500.
So in summary, we must pay attention to the bond market. It is the first chart I look at when I get up. Bond markets are pricing in slower growth and is causing some fear and concern. Stock markets may shrug all of this off knowing the Fed will likely NOT be raising rates. More cheap money and brrrrr. But if that is not the case, another leg lower is on track.

