It seems like I say this every few days, but if you follow financial markets, you probably heard that US stock markets made new record highs last week. Some people are calling it a bubble, others are blaming the retail crown and irrational exuberance, and others call it a chase for yield. My readers know my take on stock markets right now. I honestly do not think much fundamental analysis applies right now. Sure, you may hear things such as the ‘reopening trade’ or the ‘economy is improving’ arguments. But speaking with CFA’s and other analysts, evaluations just don’t make sense right now. Formulas and complex equations aren’t really cutting it.
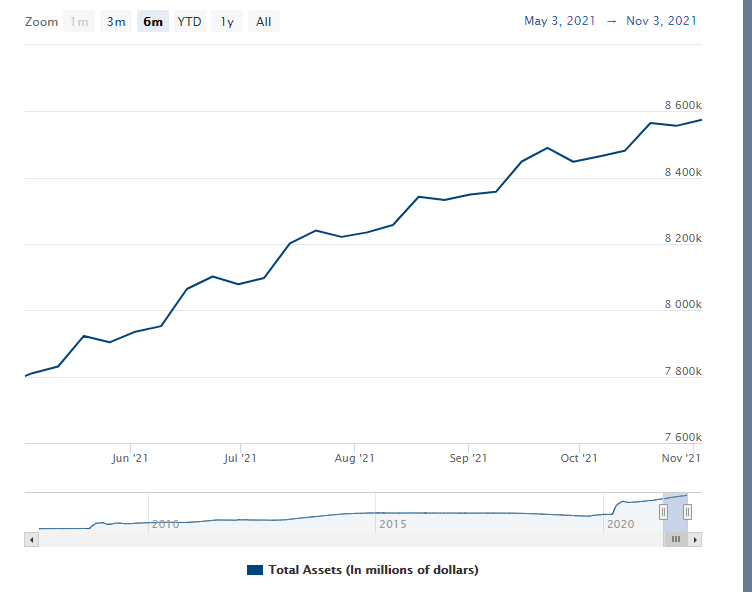
Honestly, this is what it is all about. The Federal Reserve. Even though they mentioned tapering last week, it appears as if the Fed balance sheet has hit new highs last week. But let’s not stop there. This whole market has been about chasing yield. Really since rates were low after the Great Financial Crisis. Over a decade ago, if you were about to retire with $1 million, you would buy government bonds yielding more than 5% per year. $50,000 plus per year and higher wasn’t so bad when you are retired. Now it is less than 2% or $20,000 per year.
Okay, so what’s the next safest asset? Financial advisors would NOT recommend the stock market to older clients back then. Real Estate is seen as the next safest asset, causing real estate bubbles around the world. Fast forward to today, and we have a situation where the only place to make yield is the stock markets, and other assets such as cryptocurrencies. Sure, you can trade bonds, but even pension funds don’t hold them for yield. They cannot make the 8% per year required. In a sick and perhaps twisted way, I am bullish bonds because I am betting on rates to head lower, hence bonds I am holding now are worth more than the new ones with lower yields. If interest rates normalized back then, I don’t believe we would be seeing these types of asset bubbles. But some would argue Japan and the EU gave us a good case on low rates for a long time and NO asset inflation. However, I think that money came to the US to play US treasuries or stocks. We know the Bank of Japan is the largest holder of Japanese ETFs now and actively buys stocks.
The question going forward is how much can central banks raise rates before breaking the government and indebted consumers. Governments have had to spend a lot of money during the pandemic. It means raising taxes, but this could lead to a recession itself as it would force people to spend less. We shall find out if the analysts who have predicted that we are like Japan and the EU now, who cannot raise rates because it would break the economy, are right in the upcoming months and years.
The Fed gave us a token taper, but $100 billion plus is still being spent per month buying bonds. Remember, this can change if certain economic data don’t pan out as the Fed is expecting. The key one being inflation, because that could raise some doubts on the Fed’s transitory call, and may require the Fed to raise rates quickly to stamp inflation out. This is why I am watching the bond markets. If you want to know where stocks are going for the day, look at the bond market first thing in the morning.
But even though I have a title stating that there is a market crash next, I am still bullish on these markets unless a Black Swan event shows up, or when the Fed changes tune. Right now the Fed still remains supportive of these markets. Don’t listen to what they are saying, look at what they are doing with the balance sheet. This market is Fed driven, and the dips will continue to be bought.
Now saying this, you all know that no market ever goes up in a straight line. There are ebbs and flows. Cycles. Pullbacks in uptrends. I believe we are in the pullback stage of markets and I will prove it on the charts.
If you prefer listening to my voice and looking at my charts ‘live’ then you can catch my latest Chart Attack video on this topic.
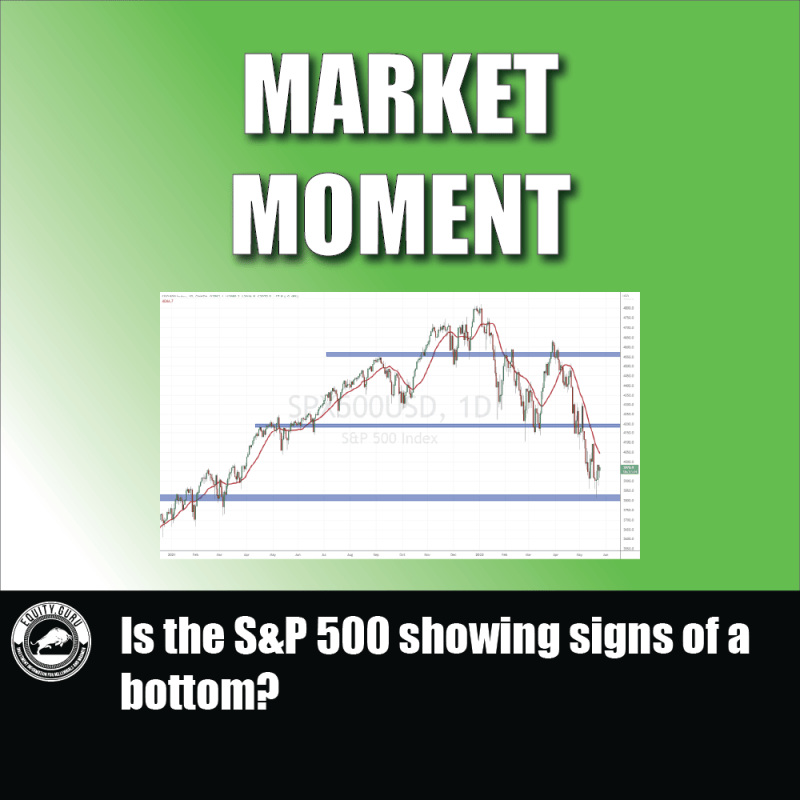
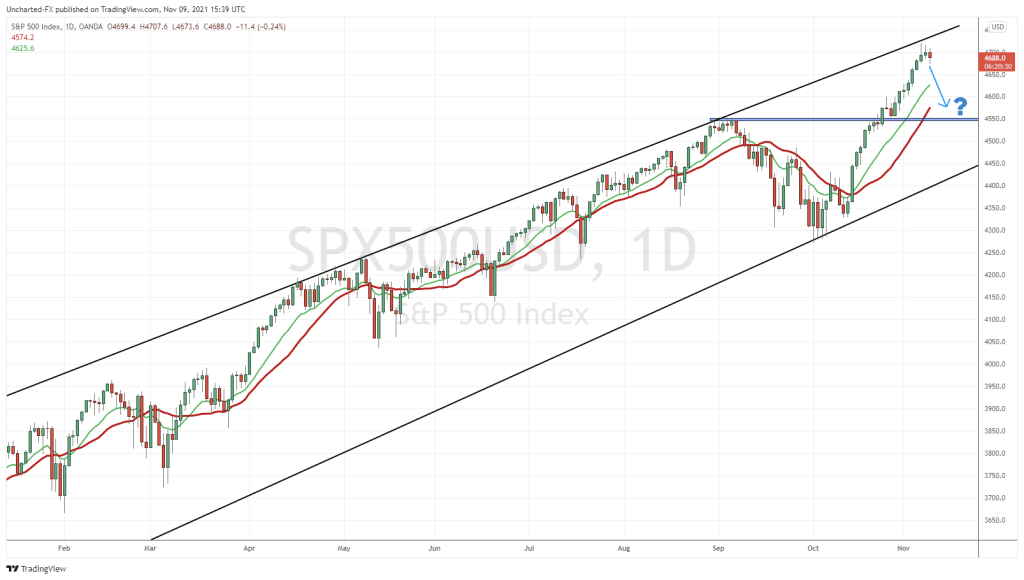
But let’s take a look at the S&P 500:
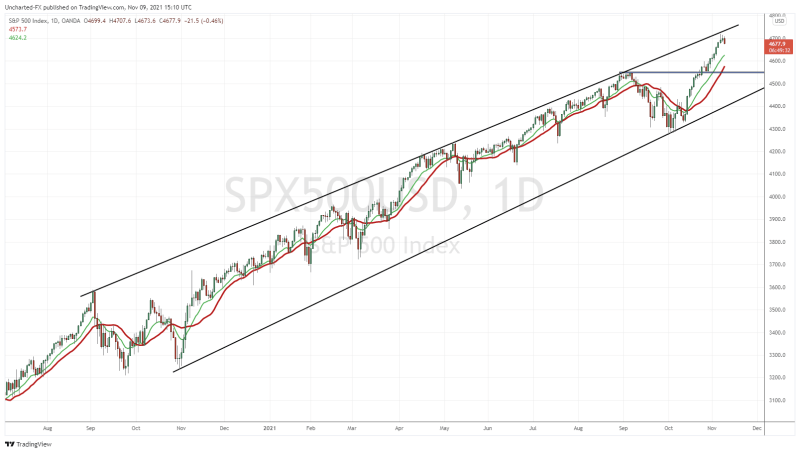
A zoomed out broader view, but I think you readers know what I am going to say. Before I comment on the trendlines here, let’s do a quick review of markets.
4550 was recent highs formed in early September 2021. We then pulled back, hitting 4300 before breaking out. The breakout occurred on October 25th 2021. Typical breakout price action. For those new to trading and investing, play breakouts. In my opinion they are better than buying at support. Trading is a business of probabilities. We want to align as many confluences together as we can. A breakout is a sign the momentum is LIKELY to continue, and usually, means we are negating the previous trend. While buying at support may give a great risk vs reward setup, there is still a good chance price continues to range, or just breaks down lower.
If you missed the breakout, don’t sweat. Don’t FOMO into the trade. A breakout always will pull back to retest the breakout zone. Sometimes in a few weeks, or sometimes in just a couple of days. In the case of the S&P 500, the retest happened in a couple of days. Note the large green body candle too. Indicated buyers were stepping in. This is the type of price action you want to see on retests.
The rest is history, the S&P 500 continued to rally for 8 days. Now to those trendlines.
Since we have no resistance levels anymore because we are in new record high territory, how can we establish important zones? We know the support is down at 4550, but what about resistance? A few things we can do here: we can use nice whole numbers such as 4600, 4700, 4800 etc but I would not put emphasis on all of them. I would just focus on the big numbers such as 5000.
Another possibility is to use the fibonacci tool. Just as I have on Tesla stock and Ethereum a few weeks ago. Those price targets are still in play. The final way is to do what I just did on the chart.
What I have drawn is a price channel. Our Equity Guru Discord members were given the heads up on this before this article and my video. Do join us over on Discord where I post charts and market news daily.
Back to the trendline. When I connected all the highs of the S&P 500, they connected nicely and we can use the trendline to project future resistance levels. This is a valid trendline because we have 3 or more touches. This is the criteria I use for all trendlines.
Note how in the past three days, the S&P 500 rejected that trendline. Other analysts are paying attention to this zone. Going forward we are now playing this channel.
To spook you guys a bit further, let’s zoom down to the 4 hour chart of the S&P 500:
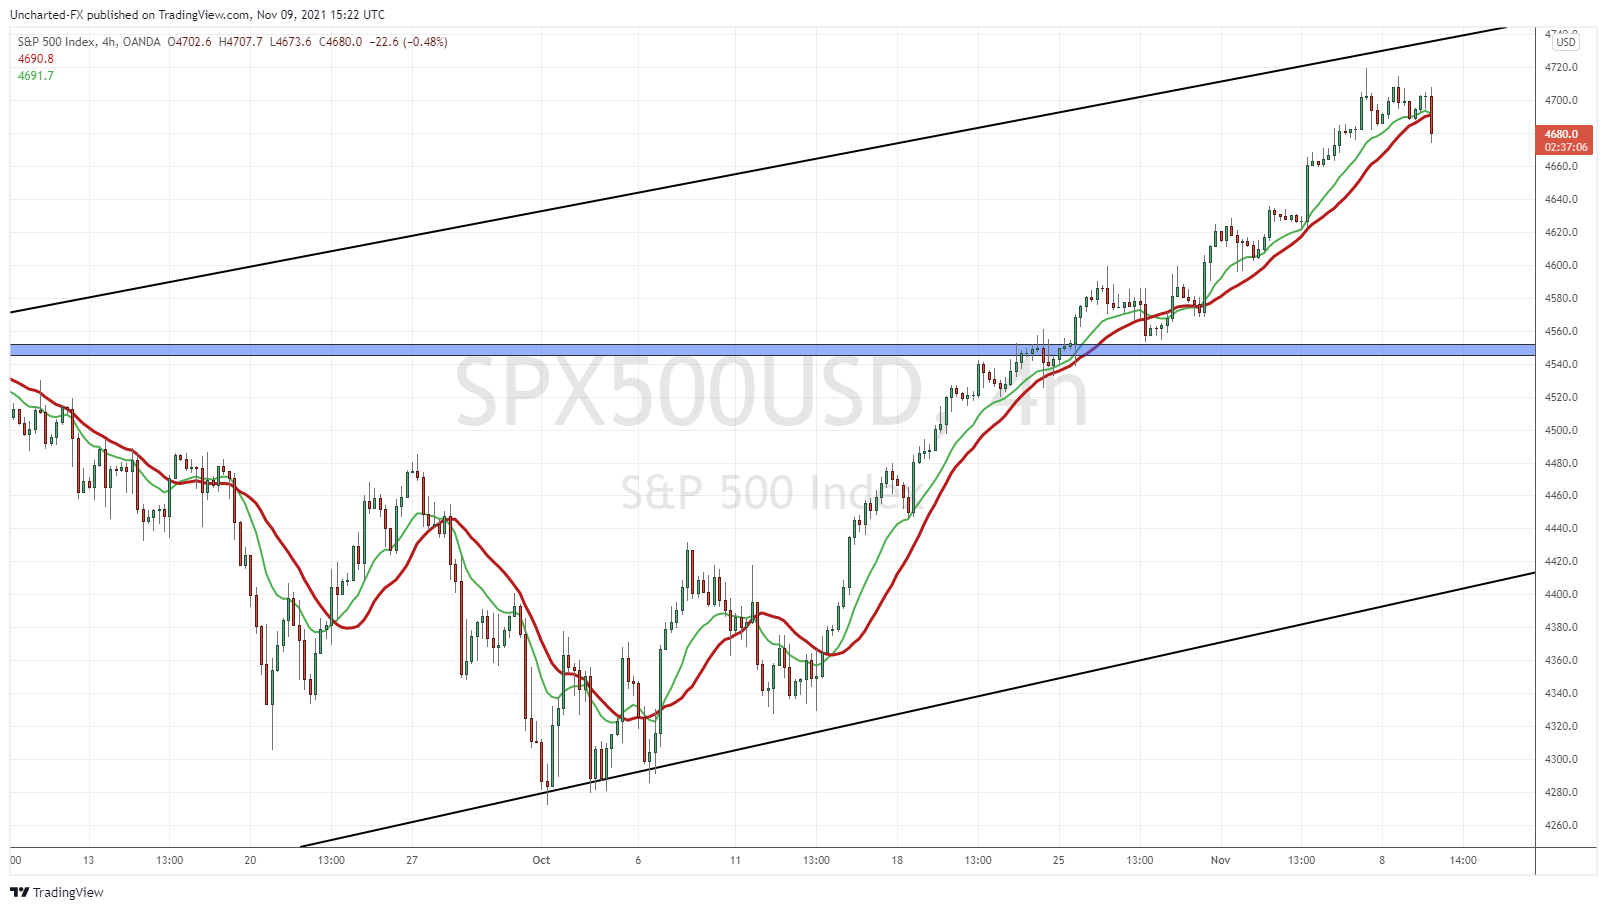
Note the current range we have near the trendline and close to the 4700 zone. After a nice uptrend, price began to stall. Signs of a pullback.
This is what I want to see. I would love to see the month of November being a pullback month, where markets drop back down to the 4550 zone. Then in December, or late November, is when we bounce from that support once again, and break out into new record highs. Basically taking out highs just made a few days ago.
I am not saying this is drastic. Not a bear market nor a market crash. Just a pullback. If one day we break below the lower channel on the S&P 500, then we can start addressing stock market crash calls.
If you are not sold on the trendline, then here are a few charts to watch and can aid us in determining where markets go.
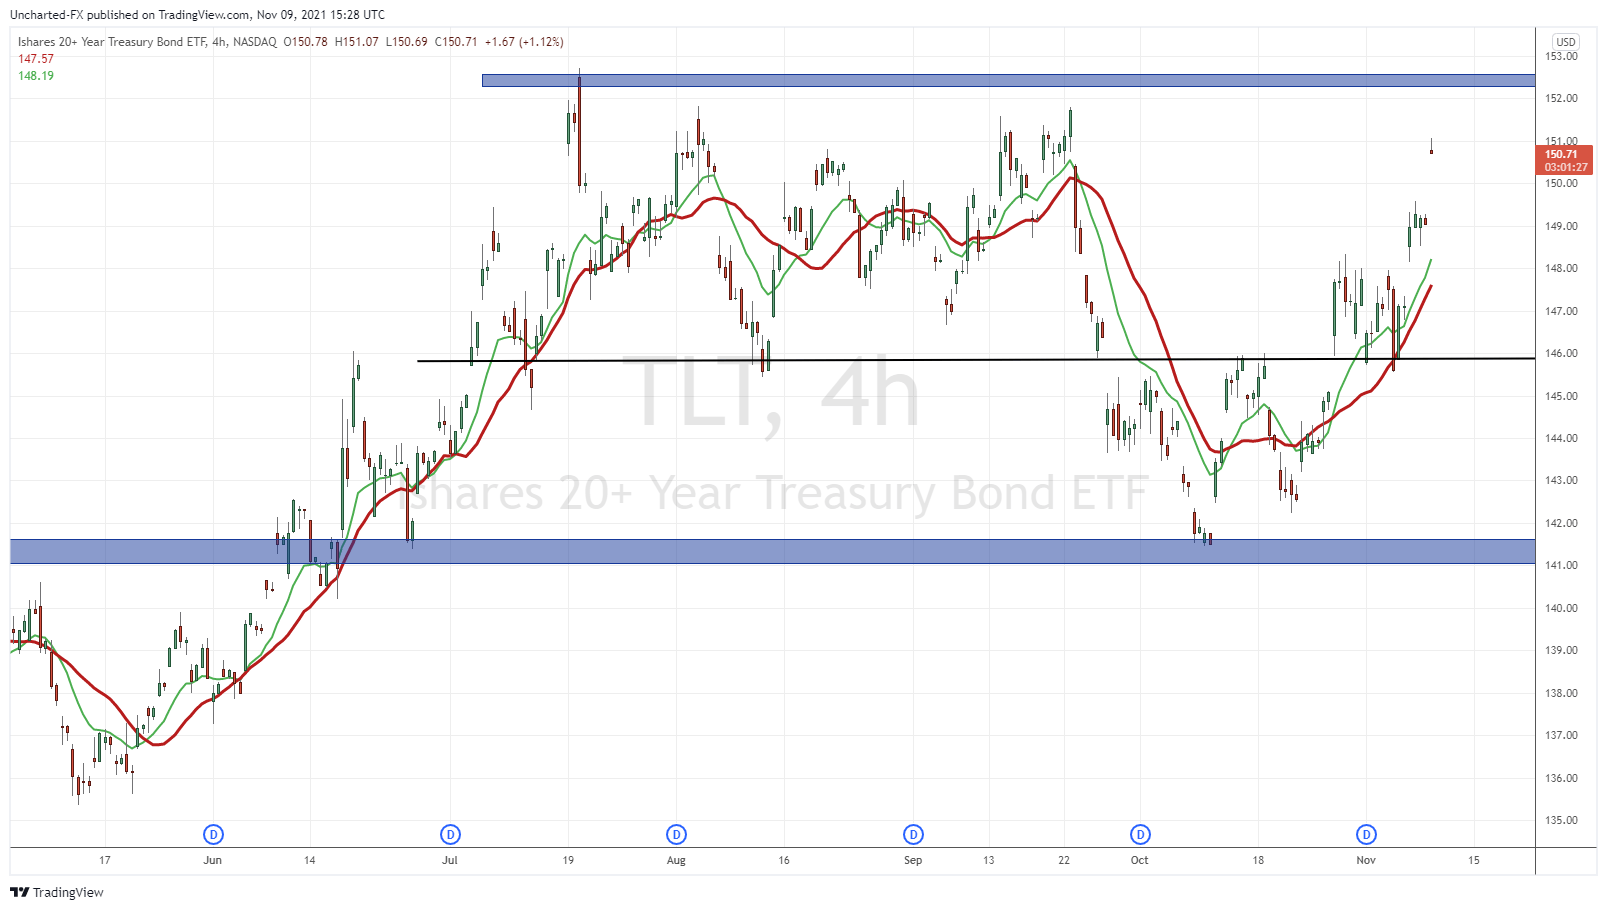
As mentioned earlier, the bond market is the first chart I take a look at when I get up. Just simple risk off and risk on money flows. When there is fear, money runs into the safety of bonds and leaves stocks. When there is no fear, then the opposite. We had a big pop in bonds today. The stock markets will not like this.
Of course this gets a bit complicated when you factor in the Fed and them buying bonds, which they have been doing since the beginning of the pandemic. However, the Fed did mention tapering…so they will have to sell some bonds. But right now, the bond market is showing lower rates rather than higher rates. Completely opposite of what mainstream financial media is saying. So perhaps we are like Japan…where rates cannot rise and we can predict the Fed kicking the can down the road. They just need an excuse to save face.
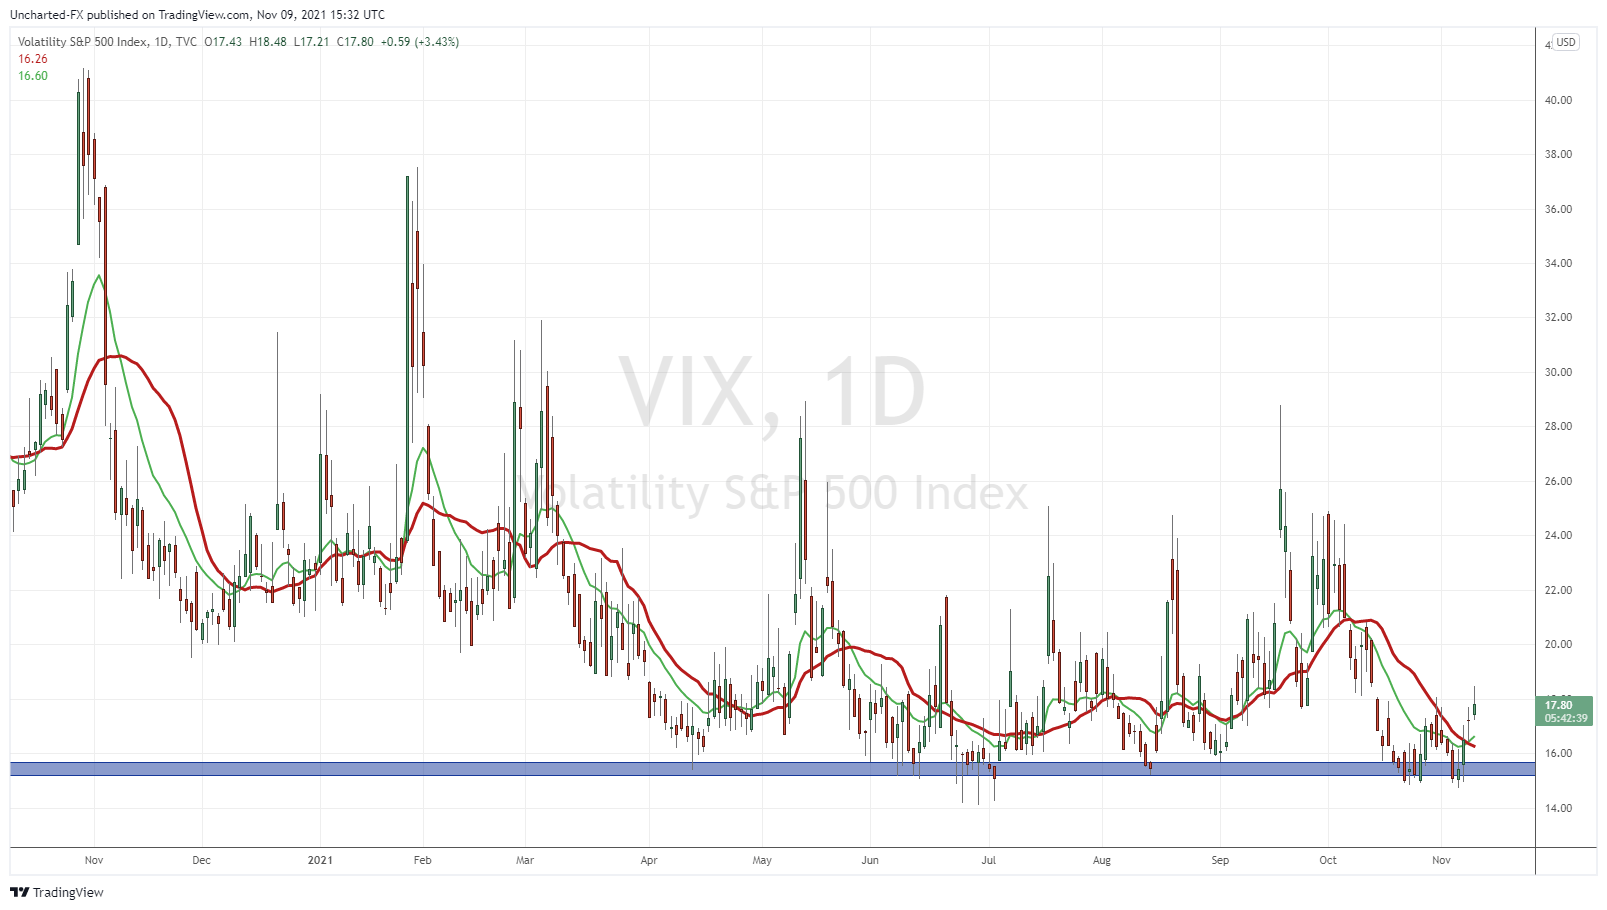
The VIX is also a good indicator of fear. When you have both the VIX and bonds popping, it is a pretty good indicator of the current market sentiment. Keep your eyes on this VIX chart as we hold support at 16.00. Of course if the VIX just remains ranged here, that is stock market positive. The best time to trade is when the VIX is low. The top trade on Wall Street has always been long stocks and short the VIX. So when the VIX pops up, it is time to be cautious.
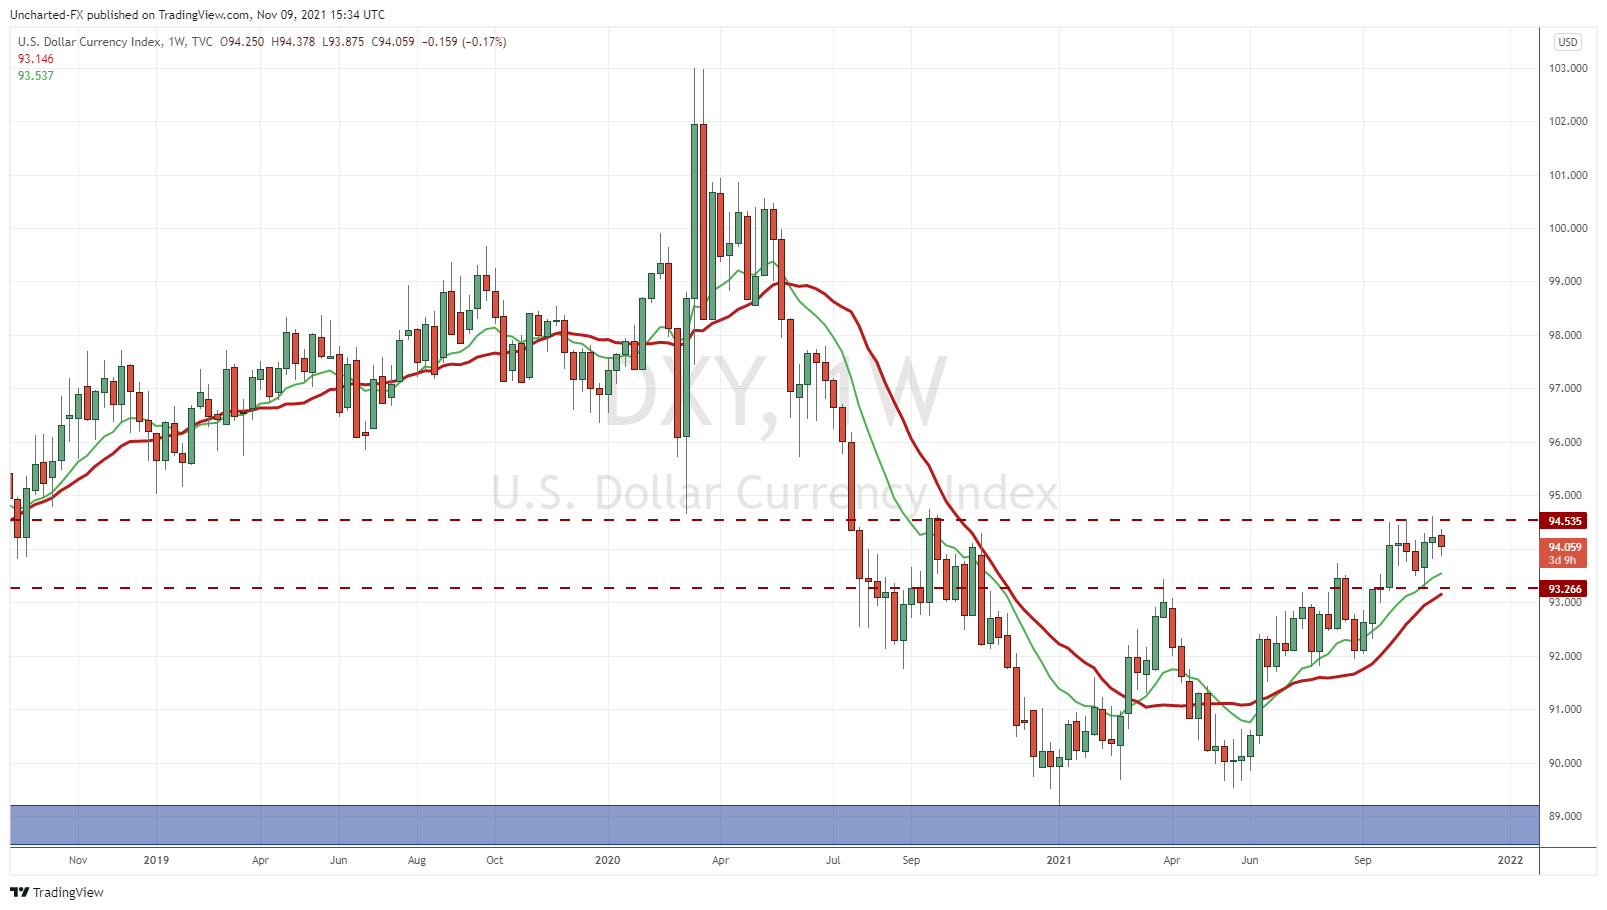
Finally, the US Dollar. A chart that I have labelled as the most important macro chart right now. Regular readers and Discord members were notified of the double bottom on the DXY WEEKLY chart. A Dollar bull market could be in its early stages. We are watching for a weekly close above 94.50, a zone the DXY could not take out after 6 weeks of trading. If we get this close above 94.50, we have a breakout. This could mean the dollar is rising because the Fed is tapering and is hinting at rate hikes…which could be negative on stock markets if you believe markets are propped on Fed monetary policy. Or an alternative. The Dollar is rising as a safe haven status. Meaning some fear is driving money to run into the Dollar.
The Fed is the key to all of this, and this is why I implore readers and market participants to keep an eye on these charts. Look at what is being priced in rather than what the Fed is saying. On the Stock Market front, we are not expecting a market crash anytime soon, but a pullback is looking very likely given the rejection of this uptrend channel.