Tesla is on a run! If you have been following the stock markets or financial news…heck even if you follow Elon Musk over on Twitter, you have probably heard that Tesla is now a $1 Trillion Dollar company. Now, the next question is whether or not CEO Elon Musk will become the first $1 Trillion Dollar man! That’s what Morgan Stanley thinks. But as of now, Elon Musk is worth a bit over a quarter of 1 Trillion, with a net worth of $288.6 Billion, making him almost $100 Billion wealthier than Jeff Bezos. That’s some wild stats.
With a $1 Trillion plus market cap, Tesla joins the club which includes Apple, Microsoft, Alphabet (Google) and Amazon in America. Facebook was once a $1 Trillion dollar company but dropped below. It still hovers around the $900 Billion market cap area. Saudi giant Saudi Aramco is also a Trillion dollar company. Actually close to $2 Trillion alongside Apple and Microsoft.
Tesla has seen many headlines recently. Some bad. Some good. There has been a payout of $137 Million to a racially harassed worker. Senators asking for Tesla’s autopilot to be investigated by the FTC. Routinely hear about Tesla cars catching on fire. And of course, some analysts and Tesla bears saying Elon Musk is bowing down to Chinese pressures. I’m a positive person, so let’s be sure to highlight the positives. Well one was recent earnings and record deliveries.
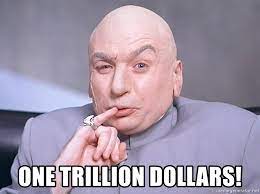
Record revenues and profits for Tesla in Q3 2021. Here are some highlights from about a week ago:
Earnings per share (adjusted): $1.86 vs $1.59 expected
Revenue: $13.76 billion vs $13.63 billion expected
The company reported $1.62 billion in (GAAP) net income for the quarter, the second time it has surpassed $1 billion. In the year-ago quarter, net income was $331 million.
The record results were driven by improved gross margins of 30.5% on its automotive business and 26.6% overall, both of which are records for at least the last five quarters.
Automotive revenue rose to $12.06 billion and costs of automotive revenue amounted to $8.38 billion for the quarter.
Tesla also generated $806 million in revenue from its energy business, which combines solar and energy storage products, and $894 million in services and other revenue, which includes vehicle maintenance and repairs, auto insurance and sales of Tesla-branded merchandise among other things, Tesla has disclosed in past financial filings.
For its energy and storage business, costs of revenue rose to the highest number in the last five quarters to $803 million during the third quarter.
And then the big news on Monday October 25th 2021.
News came out that Hertz was going to be purchasing 100,000 Tesla cars to develop its Electric Vehicle Rental Car fleet. That is 100,000 Model 3 vehicles in a deal valued at around $4.2 Billion, and vehicles to be delivered in a period of about 14 months.
So I did some digging, and currently, Hertz’s fleet is 400,000 vehicles. So a purchase of 100,000 cars means a purchase equaling 25% of their fleet right now. Big numbers. Lot of questions whether the company can afford this since they declared bankruptcy back in May of 2020 during the pandemic when demand for rental cars was waning. However, investors from Knighthead Capital Management and Certares Management said they would take over the company this year.
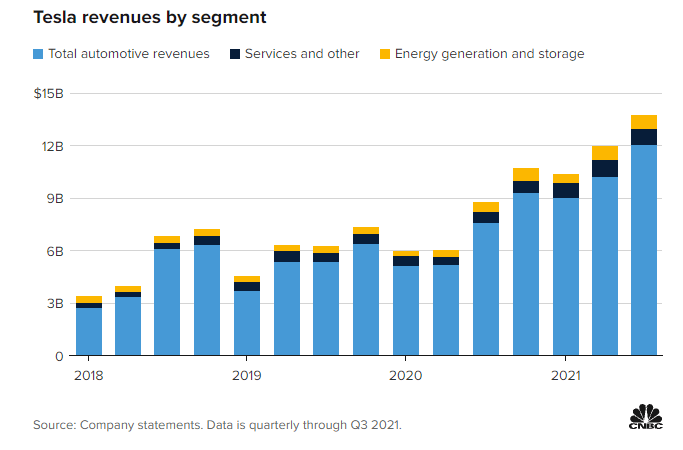
By the way, Hertz is still traded on the OTC under the ticker HTZZ:
The stock also had a nice pop on the news. But not as nice as Tesla’s.
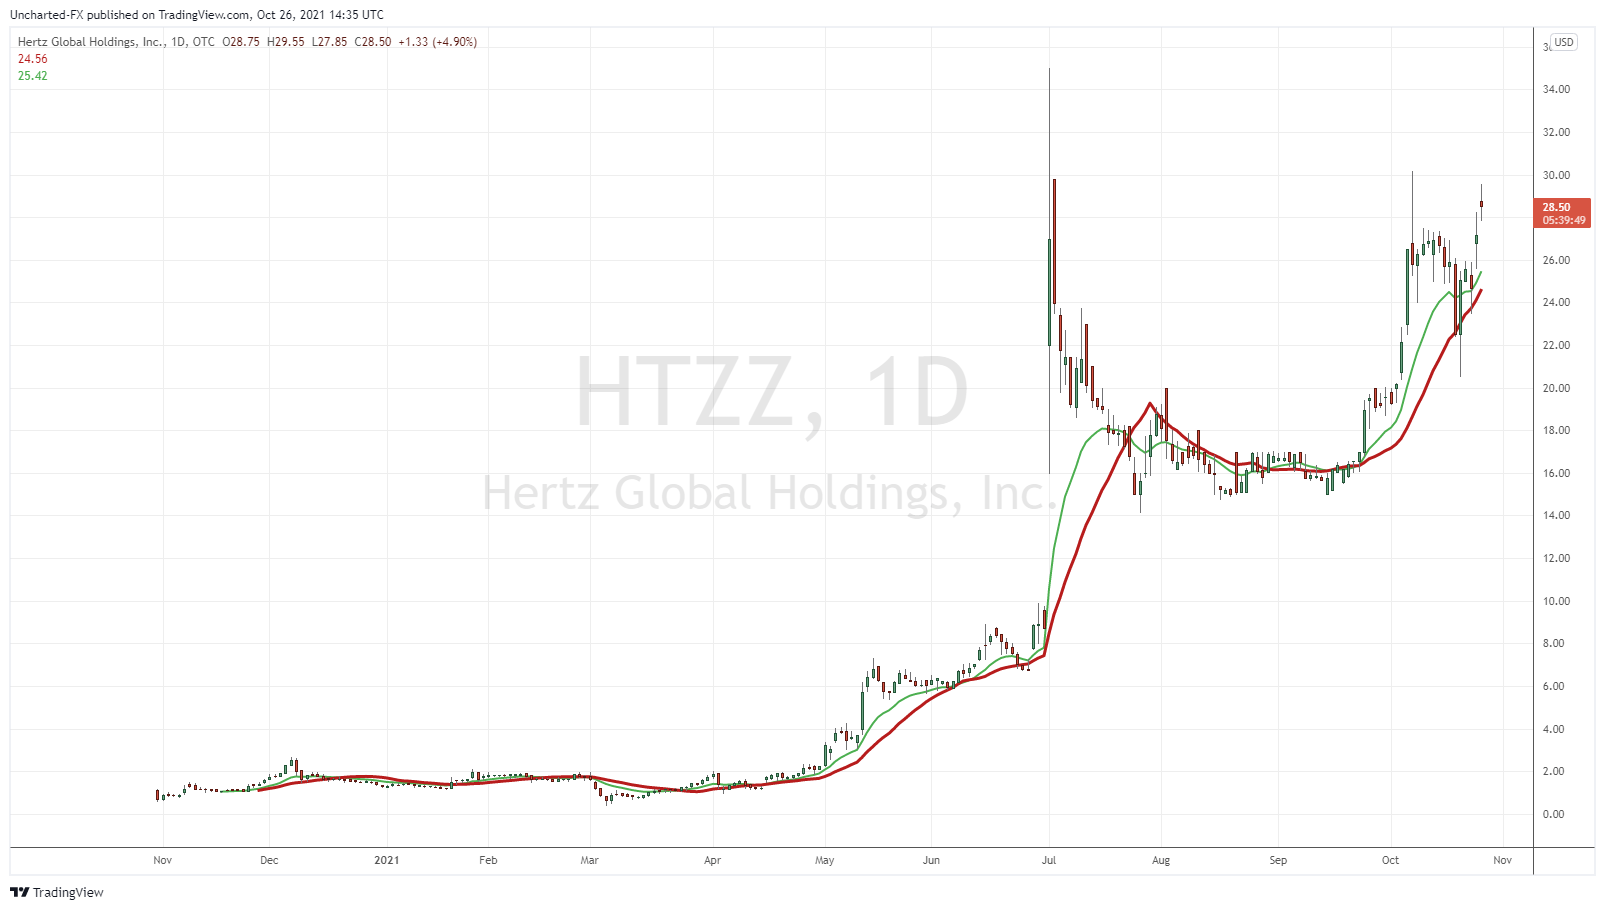
The last I covered Tesla Stock here on Market Moment, I was talking about the support retest of $550. A nice structure developed on Tesla. For members of Equity Guru’s Discord channel, you were notified of this pattern, but more importantly, when the breakouts occurred. Let me show you the Tesla chart and give you a bit of a blow by blow.
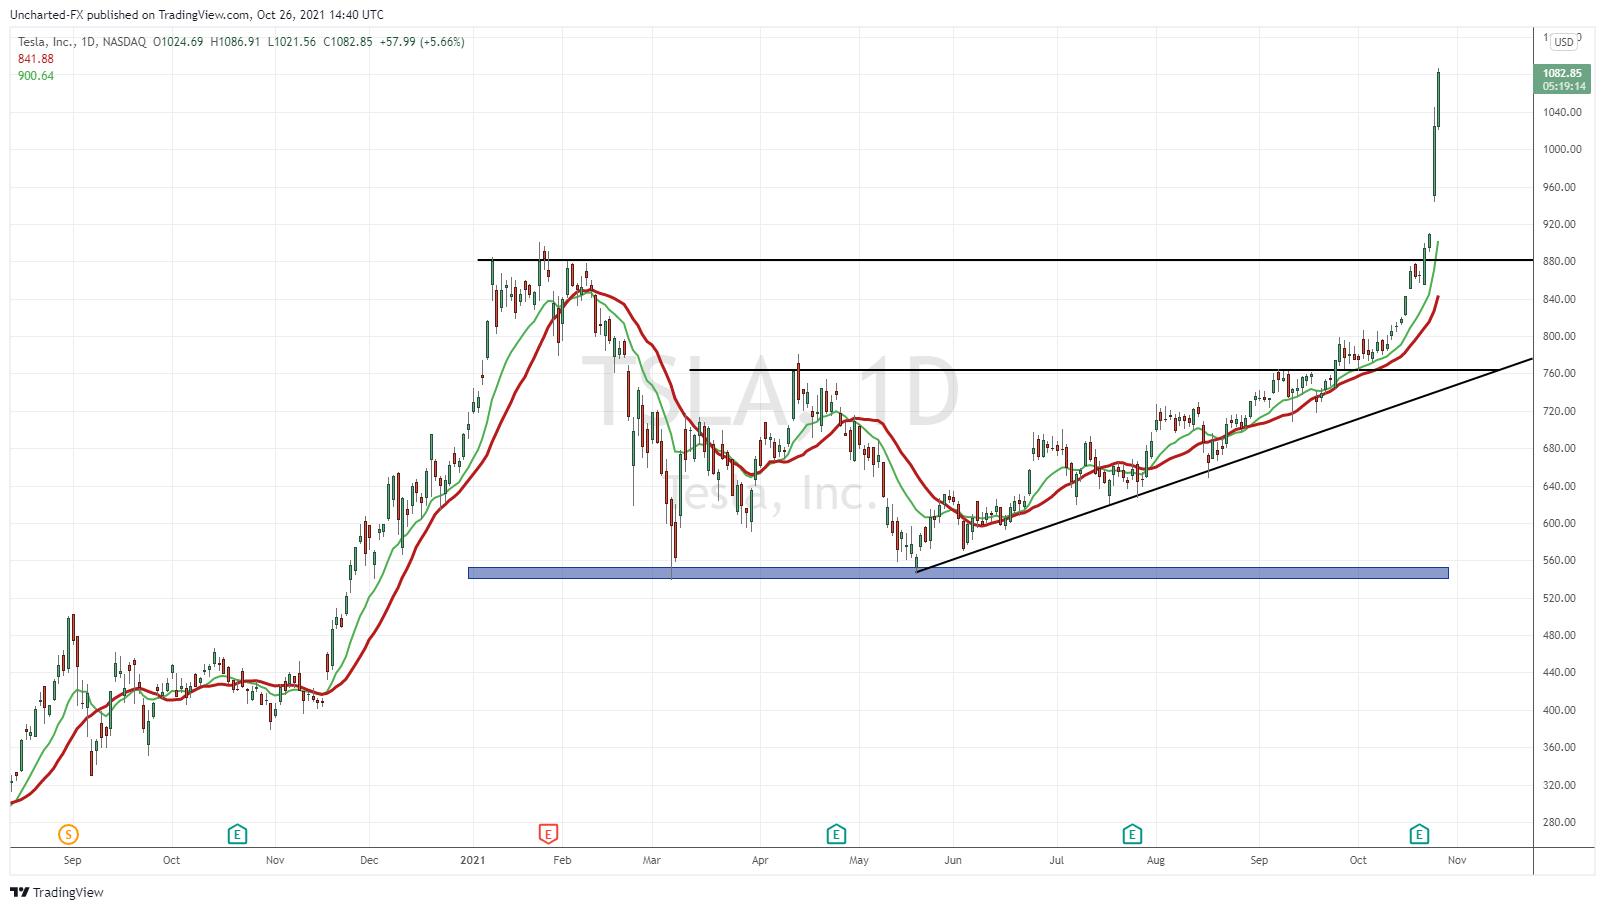
People might disagree about the company being overvalued and such, but you just cannot argue the chart. By the way, all of us are waiting for Dr. Michael Burry’s comments on the recent move.
The chart has looked extremely bullish ever since the major breakout of $760. Perhaps this run says more about the current market environment rather than future fundamentals, but I trade the markets I see, not the markets I want to see. You can still trade the company and make some cash even if you don’t agree with its current market cap.
We then got a close above the major $880 resistance, and I knew it was about to go crazy. Parabolic right now. Where to next? Well first let’s establish some support in case of a pullback. Actually not in case, pullbacks happen. Breakouts see retests which allows buyers, who missed the recent rally, to jump in and catch the next wave up. Technically, we are looking at the $880-$900 zone. However, I would just be curious to see how Tesla stock reacts at $1000. I mean that is a very big psychological number now. If the latter occurs, then watch for some sort of basing at $1000 to indicate buyers entering there.
Now for future price targets I am going to do something different. Morgan Stanley analysts have a price target of $1200. Cathie Wood has mentioned a long term price target of $3000 per share. I am going to give you guys the price targets from my handy dandy fibonacci tool. What fibonacci does, is it uses the Golden Ratio (Phi) to map out cycles and important zones in markets. It seems like magic and wizardry but it is spookily accurate. If you are into market cycles, and Elliot Waves, you have come across Fibonacci. I won’t get into too much detail about it, but basically you use it to connect the recent low to high and the fibonacci extensions give you the next price targets.
Below, I have fibbed the move from $70 to $902 and this is what I get:
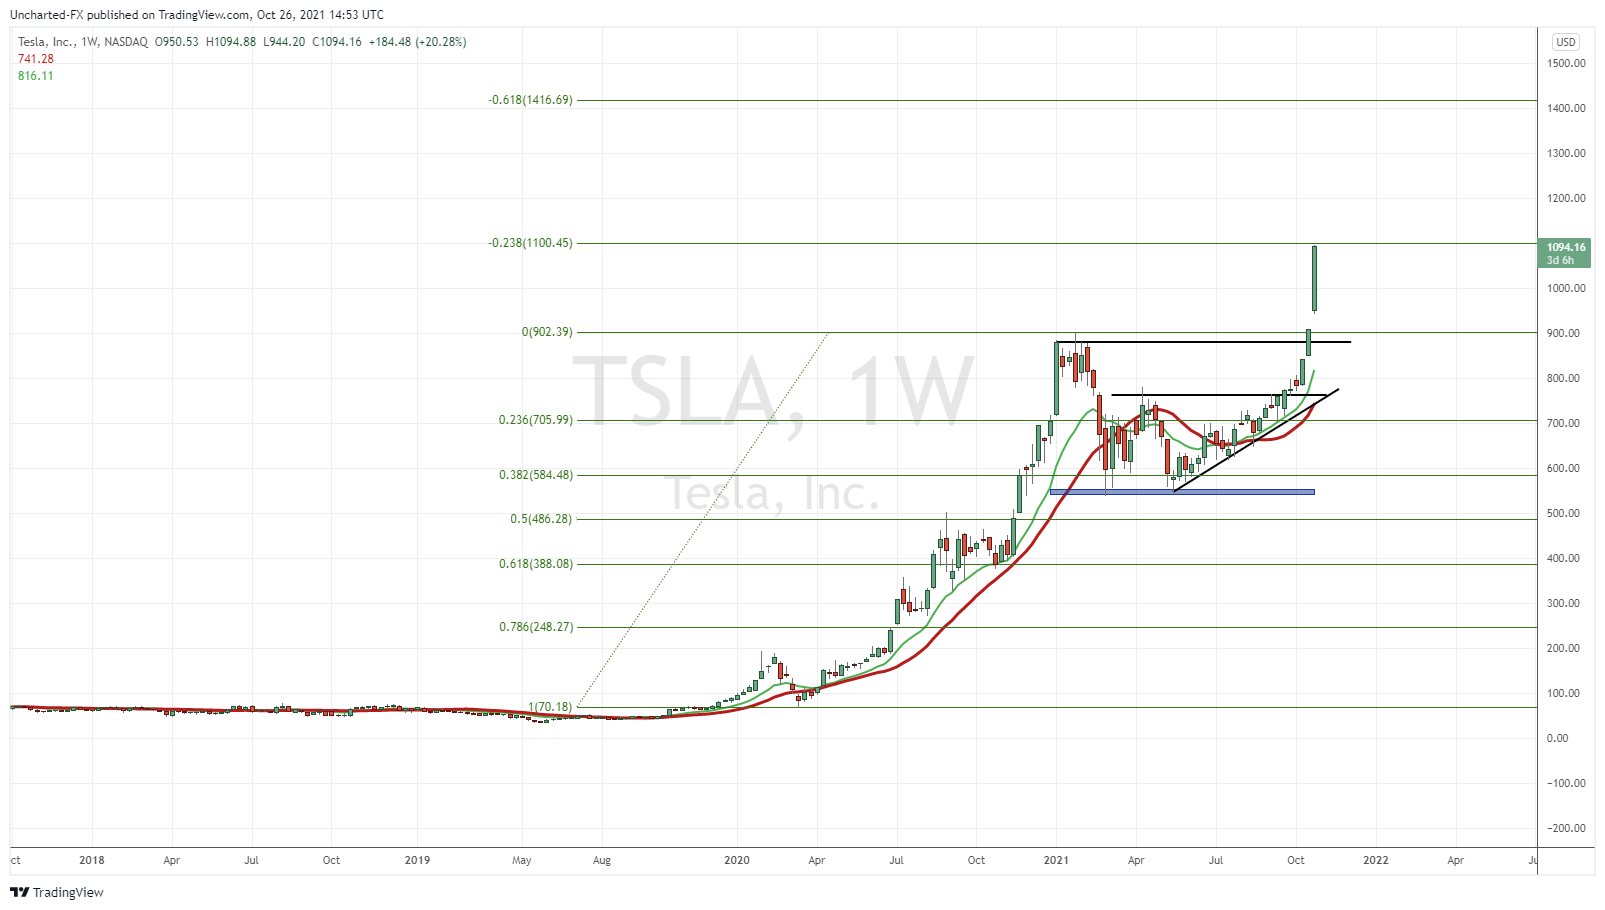
As you can see, we are actually approaching a first target here at $1100. Not sure if you can see it, but we actually have had some reaction here. The fib touch is showing a bit of a sell off. Traders are taking profits here. As I said. Magic.
However, we can still close above this fibonacci on the daily. Just think of it as resistance and support. If we break above it, then the NEXT fib target becomes the new resistance. That would come in at just above $1400, or $1416.69 (nice) to be exact.