Earlier this week, I published an article explaining the current market sell off. Investors are waking up to the stark realization that inflation is not transitory and will magically reduce. That the Federal Reserve will need to raise interest rates quicker and in large amounts in order to tame inflation. Any hawkish statement from Fed members sees the stock market drop hard. I highly suggest you read that article as it explains the difference between Central Bank ‘transitory’ inflation versus the ‘permanent’ inflation the contrarians have been talking about.
In this Market Moment, I want to do a purely technical review of global equity markets. There will be a lot of charts and price levels. Some really big breakdowns have occurred, and are about to occur. For those who are members of our free discord group, you were notified of shorts on equity markets. Including the US markets, which broke below or higher lows.

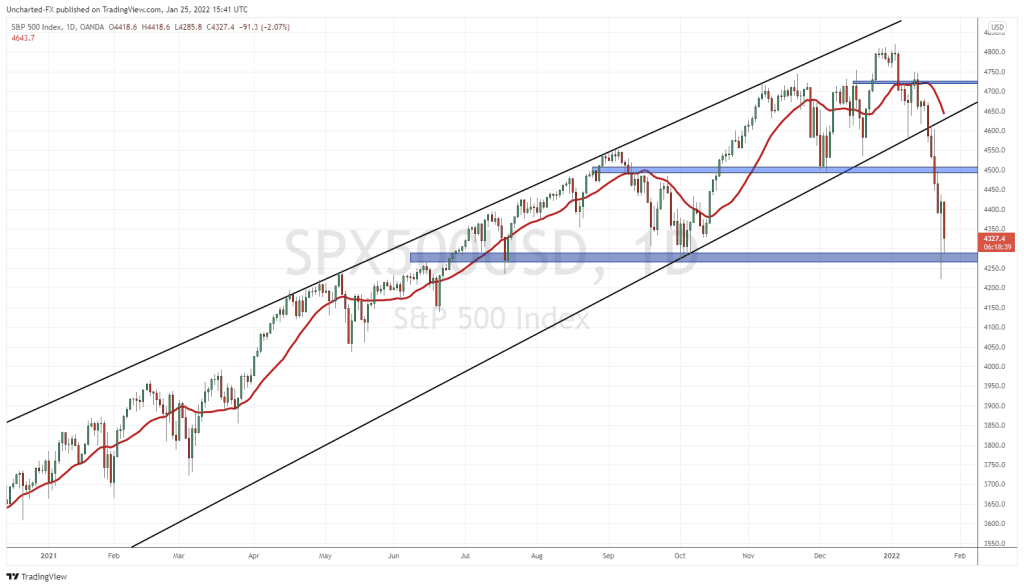
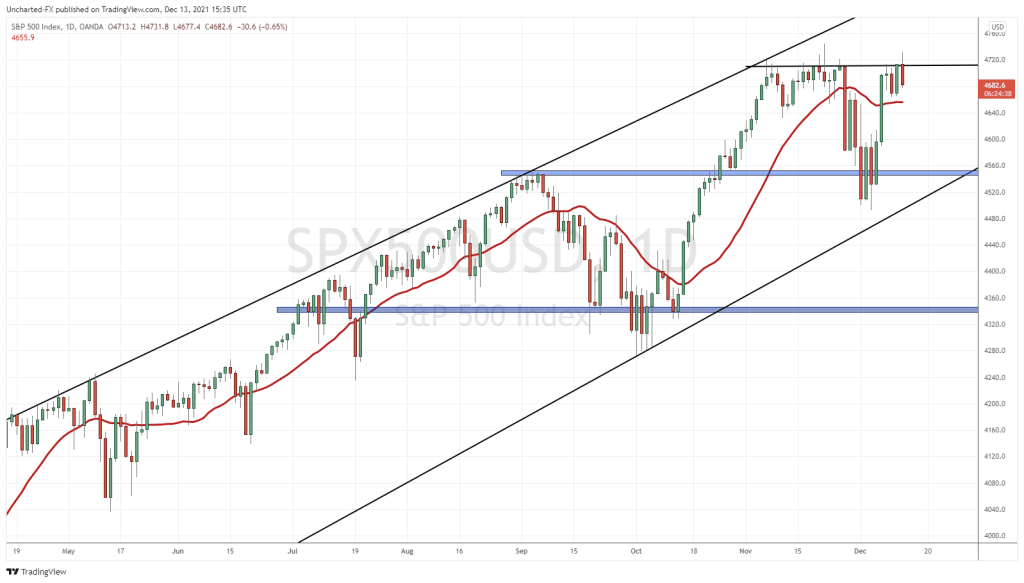
Let’s start off with the most important chart for the remainder of the week, the S&P 500. As noted above, the higher low we were working with was at 4500. That broke, and then we took out the support at 4400. For us to turn bullish, we would want to see one of two things. Either we close back above 4400, or we develop basing here which means a few days of daily candles with price remaining at this current support level. That would tell us that the selling pressure has been exhausted, and bulls can once again take control.
But here is the key: this 4150 zone is major support. We held above this level in parts of early February 2022 and parts of March 2022. The recent lows. If we get a strong, large red body candle close below 4150…uh oh.

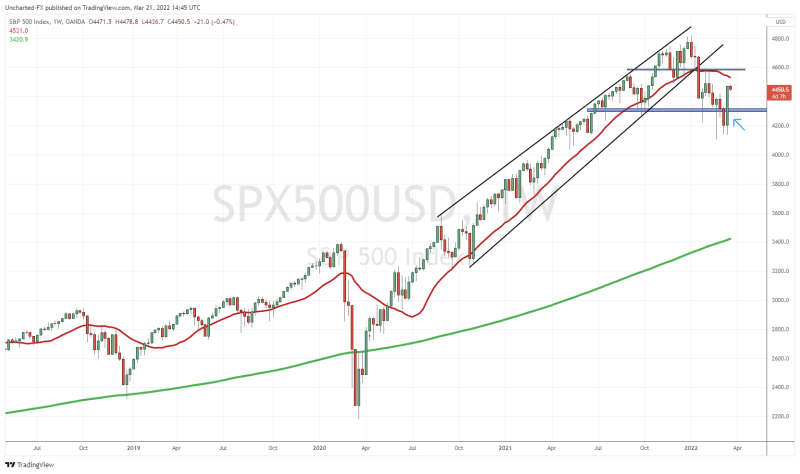
Just to hammer in the importance of 4150, take a look at the weekly chart. Do you see it? We have a head and shoulders pattern printing, one of the most powerful reversal patterns. However, it doesn’t mean we sell just yet. You see, these reversal patterns have triggers. In this case, the trigger would be a weekly candle close below 4150 on the weekly chart. Or in other words, if we close below 4150 and remain below it by the end of this week Friday, the S&P has more room to the downside. And I daresay, would be in a new bear market.

The Nasdaq is in the same boat. You can take a look at the weekly chart and you will see another head and shoulders pattern developing.
The tech index is testing major support right now. If interest rates are going to be heading higher, then tech stocks will be taking a hit. What adds more drama to the support test right now is that Facebook (Meta) is set to release earnings post market on the day I am writing this piece. Many are expecting a second gap down sell off just like Netflix. This could weigh heavily on the Nasdaq and see us close below major support.

The Dow Jones has some room to fall. If you are a member of our discord group, yesterday morning I gave members the heads up while we retested the breakdown zone at 34,000. I said that this was the best market to short just by looking at the charts from a risk vs reward perspective. We remain bearish unless the Dow Jones can get a daily candle close above 34,000 nullifying the breakdown.

Now this is the big one. The small cap index, the Russell 2000, tends to lead the major US indices. And the Russell confirmed a major breakdown, increasing the probability of a larger fall in US stock markets.
We closed below 1920 with the daily candle breaking below support and even below the large wicks from Jan 28th and Feb 24th of 2022. I don’t want to get too technical, but ever since the break below 2120, we have been waiting for the first lower high. It took over 4 months, but we finally got the first lower high in a new downtrend confirmed.
If we do get a relief rally in stock markets, the retest of 1920 will be crucial. Either new sellers jump in taking us much lower in this new downtrend. Or bulls can take us back over and the downwards momentum is nullified. I won’t lie, but because of this breakdown on the Russell, I have a feeling the S&P and other equity markets will end up breaking their support. Not looking too good.

On the TSX, the Canadian market was one of the few indices to print new all time record highs in 2022. So did the Norwegian OBX. Both of these indices owe a thank you to oil prices.
We have been watching the 21,600 level as support and to confirm the continuation of the uptrend. Unfortunately, it did not hold. Major breakdown on the TSX. Now we will be watching the next major support just above 20,400.


A photo dump. Above are some European equity markets. The German Dax, the French CAC, the UK FTSE and the Italy 40. As you can see, the structures look similar. We have rejected major resistance, and have now broken below interim support. To me, they look very bearish and I personally have some shorts on the major European equity markets.
The Russia-Ukraine situation adds more bearish elements to Europe. I am one of those that think Europe will be in trouble if they don’t get Russian gas. Lucky for them, the weather is warming up. But come Winter, Europe could be in trouble. The drama is already starting with Russia turning off the gas to Poland and Bulgaria who have refused to pay in Rubles. Even though other European nations are putting up a strong front, it is quite obvious that many of them are discreetly buying Russian gas. Just take a look at the recovery of the Russian Ruble.


I have been focusing on Asia lately. I wrote a piece last week on the fall in the Japanese Yen and the Bank of Japan. Super important. Crazy things are happening in the Asian currency markets. I will be publishing another piece next week on the next big currency to have a move similar to the Turkish Lira, the Russian Ruble and the Japanese Yen. Hint: the currency is an Asian currency. The Bank of Japan is key, but we will have some relief as Japan enters its Golden week holiday beginning in the first week of May.
China is also not garnering much attention. The Chinese markets have been tanking, and so has the Chinese Yuan. This comes after the People’s Bank of China had their ECB “whatever it takes” moment last month. Doing whatever it takes to keep Chinese stocks propped. The announcement didn’t tell us how, and the PBoC still has not told us how, but Chinese stocks saw a nice bounce.
Large bounces that just became lower highs in the next leg down.
It really is a race to the bottom between Asia and Europe. Now, we just wait to see which breaks first.
Equity markets are looking weak. But the hope? Something breaks way before central banks can hike interest rates to higher levels causing them to pause, or even reverse policy.