Oil prices took a distressing dip to their lowest in more than three months due to a growing demand destruction with the International Energy Agency predicting a significant slowing in global oil demand by 2028. In fact, the U.S. Energy Information Administration expects total petroleum consumption to fall by 300,000 bpd this year in the U.S. compared to its earlier prediction of a 100,000 bpd increase.
Currently, the American labor market, although robust, is slowing. China’s economic growth over the last year has been categorized as disappointing. Demand for black gold from two of the world’s largest consumers has waned at least for the time being.
According to the US Treasury, risks continue. Tighter credit and continual uncertainty over government funding continue to cast a shadow over progress in the United States. Significant growth in American stockpiles and higher OPEC production forecasts compound the situation.
Is a recession in the U.S. still a possibility?
If you look at yield curves, the New York Fed models using 10-year treasury bond yields, estimates a 61% chance the U.S. experiences a recession in 2024. Wall Street economists peg this chance at 48% while the average person on the street fears there is a 69% a recession hits the U.S. in 2024, while CEOs take a dimmer look with an 84% chance.
Not everyone is so doom and gloom however, Goldman Sachs has stated “the hard part is over’ for efforts to shore up the global economy. The bank forecasts inflation will continue to ease over 2024, leaving the US with only a 15% chance of slipping into a recession. OPEC+ also chimed in positively, declaring the global economy as healthy, despite the financial challenges currently facing the major economies such as US, China and Russia.
So, what does this mean for oil and gas investors?
Fossil fuels are losing their luster compared to greener renewable energy technologies, but that said, they will be an integral part of our society for at least the medium term. Oil and gas stocks were among the top performing stocks on the S&P 500. Berkshire Hathaway is still heavily invested in companies like Chevron and Occidental Petroleum. Why is this?
Despite the impending energy transition, oil and gas stocks, like gold, are a hedge against inflation. They can also balance out your portfolio. When oil and gas prices rise, the economy slows down causing other stocks to fall, however as energy prices rise so do oil and gas sector stock values – voilà, insurance against hard times.
What about peak oil?
The term “peak oil” has been around since geologist M. King Hubbert theorized it in 1956. Since then peak oil has been predicted to hit between 1965 to 1971, 1995, 2005, 2006, 2008, 2020, 2030 and 2045. Obviously, we haven’t hit peak oil to date, thus forward predictions from now are debatable to say the least.
Technically speaking with Vishal Toora
After hitting prices above $90, oil has fallen below $80 on both West Texas and Brent Crude, lessening the fears of a surprise uptick inflation report. But the drop in oil prices comes from reports on concerns of waning demand in the United States and China.

West Texas closed below the current higher low near $90. That is when the uptrend was technically in danger of being over. Oil attempted to climb back above $90 to regain the higher low zone but sellers jumped in. Oil then confirmed a break below support at $80 yesterday and continues to drop further.
Now oil is set to test a major support zone. You can see how important the $72-$74 zone is just by looking to the price action to the left. This is where shorts would be taking some profits, and where buyers could enter for a reversal. This is a zone where selling pressure could exhaust.
I say could because the candles need to give us signs. I would be watching for a large wick candle, a large green engulfing candle, and a range showing that selling pressure has exhausted. A breakout of said range would then lead to a bounce at this support.

For those a bit eager and follow the oil markets regularly, you can front run a reversal on the 1 hour intraday chart by watching for a 1 hour candle close above the $77.50 zone. This would take out the current lower high on the intraday chart.
Stops would be placed below the major daily support zone.
I must say that the current lower high on the daily chart comes in at $84. This means there would still be some work to be done to confirm a swing trade/medium term reversal.

Meanwhile Natural Gas has an interesting setup. Gas has broken above the $3.00 resistance zone and has hit recent highs of $3.66 before pulling back. The breakout is still intact as long as natural gas remains above $3.00. Watch to see how the price reacts near $3.00 support. I am sure there are technical traders and buyers waiting there. Winter is coming so seasonality, things should be bullish for natural gas.
There are various ways to invest in oil and gas, including futures, ETFs, producers and explorers. It all depends on the investor’s objective and risk level comfort. Investing in futures is complicated and risky, requiring a great knowledge of the industry, geopolitical events, technical analysis and more. ETFs do all the investing for you and give you a diversified basket of assets, but the return is nominal. Same could be said about blue chip producing stocks, but the risk increases because you’re betting on one pony instead of an entire stable. If you are comfortable with risk, understand the geology and are capable of doing your due diligence, junior explorers provide tremendous upside, but on the same note, you could watch the stock go to zero if you aren’t careful. Here are some oil and gas players you may find interesting:
Prospera Energy (PEI.V)
Market Cap ~ $41.7 million
Prospera Energy Inc., a natural resources company, acquires, explores for, and develops petroleum and gas properties in Canada. It primarily holds interests in the Pouce Coupe and Red Earth properties in Alberta and Cuthbert; and Hearts Hill and Luseland properties in Saskatchewan.
The Company has a goal to produce 1800 boe/d by the end of the year. 2024 is to be a turnaround story for the company. Prospera is currently implementing horizontal oil wells which are lowering operating costs, increasing production which leads to an increased cash flow, and extending the field life of its assets. Recently, Prospera released Q3 2023 financials. Here are some numbers:
- Realized positive Operating Income of $1,101,827 in Q3 2023 compared to $783,084 in Q3 2022.
- Reported Net Income of $71,011 in Q3 2023 compared to a Net Loss of ($779,438) in Q2 2023.
- PEI realized average sales prices of $82.15/boe in Q3 2023, compared to $85.09/boe in Q3 2022. PEI expects pricing to remain at similar levels through the remainder of 2023.
- Operating Expenses in Q3 2023 were $41.45/boe compared to $36.24/boe in Q3 2022. Increases were driven by higher vegetation control, facility de-sanding, injection volumes optimization, winterization, and preparation for additional volume throughput.

The stock is held between support at $0.08 and resistance comes in above at $0.17. Currently, the stock is finding interim support here at $0.10 which has held and is where buyers are stepping in as seen by the large wick candles and green candles here.
The stock is building a nice base here, but will need some catalyst to bounce. Perhaps a pop in oil at its current support could be the factor to lead to momentum here.
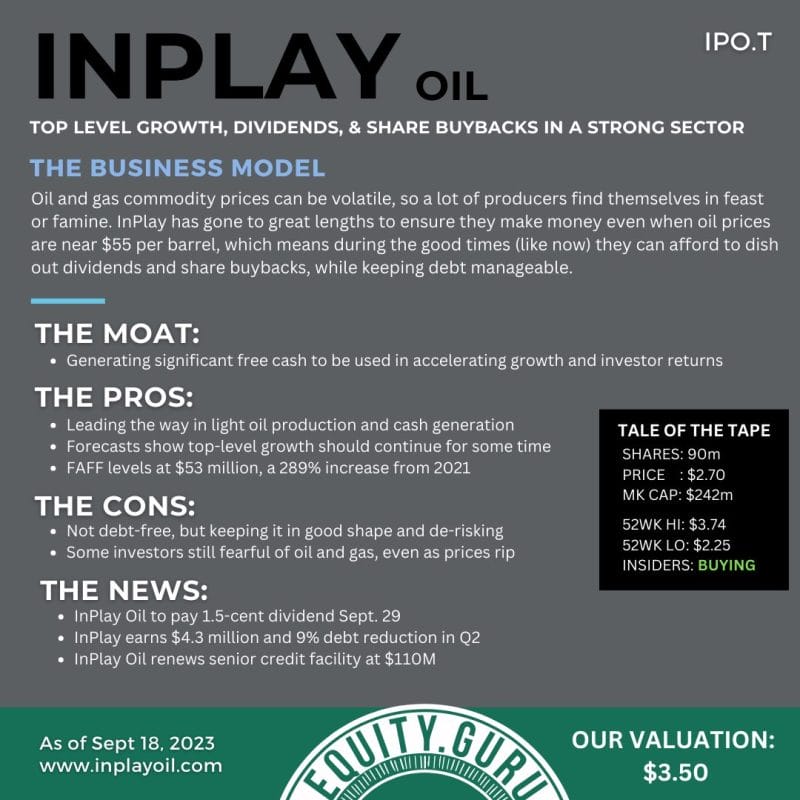
InPlay Oil (IPO.TO)
Market Cap ~ $221 million
InPlay Oil Corp. engages in the acquisition, exploration, development, and production of petroleum and natural gas properties in Canada. The company produces and sells crude oil, natural gas, and natural gas liquids. It also produces light-oil primarily in the Willesden Green area of central Alberta.
On November 9th 2023, the Company released its Q3 2023 financial and operating results. Highlights include:
- Realized average quarterly production of 9,003 boe/d(1) (57% light crude oil and NGLs), a 6% increase compared to 8,474 boe/d (57% light crude oil and NGLs) in the second quarter of 2023 despite extended curtailments and unplanned downtime experienced in the quarter of approximately 550 boe/d.
- Generated strong quarterly adjusted funds flow (“AFF”)(2) of $25.2 million ($0.28 per basic share(3)), an increase of 16% from the second quarter of 2023.
- Returned $4.0 million ($12.0 million in the first nine months of 2023) directly to shareholders through our monthly base dividend.
- Increased revenues by 17% to $46.7 million compared to $39.8 million in the second quarter of 2023.
- Improved field operating netbacks(3) by 8% compared to the second quarter of 2023.
- Achieved net income of $7.5 million ($0.08 per basic share; $0.08 per diluted share). InPlay has now returned to a retained earnings position on the balance sheet demonstrating that the Company has generated positive earnings since inception (net of dividends paid).
- Invested $27.5 million to drill, complete and equip three (2.9 net) Extended Reach Horizontal (“ERH”) wells in Willesden Green, three (3.0 net) ERH wells in Pembina and one (0.35 net) non-operated ERH well in Willesden Green.

The stock is also ranging. There is some interim support here at $2.40 which is seeing buyers step in, however the major support comes in at $2.30 with resistance at $2.75. What really will get the stock going is a breakout above $2.75 resistance.
Prairie Provident Resources (PPR.TO)
Market Cap ~ $64 million
Prairie Provident Resources Inc. engages in the exploration and development of oil and natural gas properties in Alberta. The company explores for light and medium oil, heavy crude oil, conventional natural gas, and natural gas liquids. It principally focuses on the Princess and Michichi areas targeting the Glauconite, Detrital, Ellerslie, Cretaceous Mannville, and Mississippian Banff formations in southeastern Alberta; and the Evi areas targeting the Devonian Slave Point, Gilwood, and Granite Wash formations situated in the Peace River Arch area of northern Alberta.

The stock is ranging within a wedge pattern and support and resistance comes in the form of trendlines. In terms of traditional horizontal support zones, the stock is also testing it which comes in around the $0.08 zone. Watch to see how the stock reacts in this zone. A breakout above the upper trendline gets the stock going.