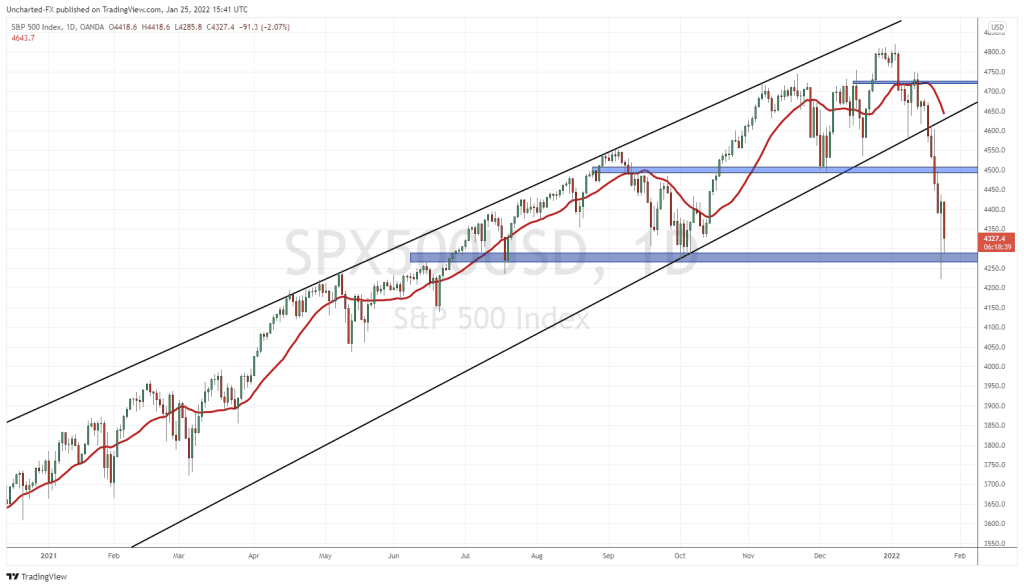
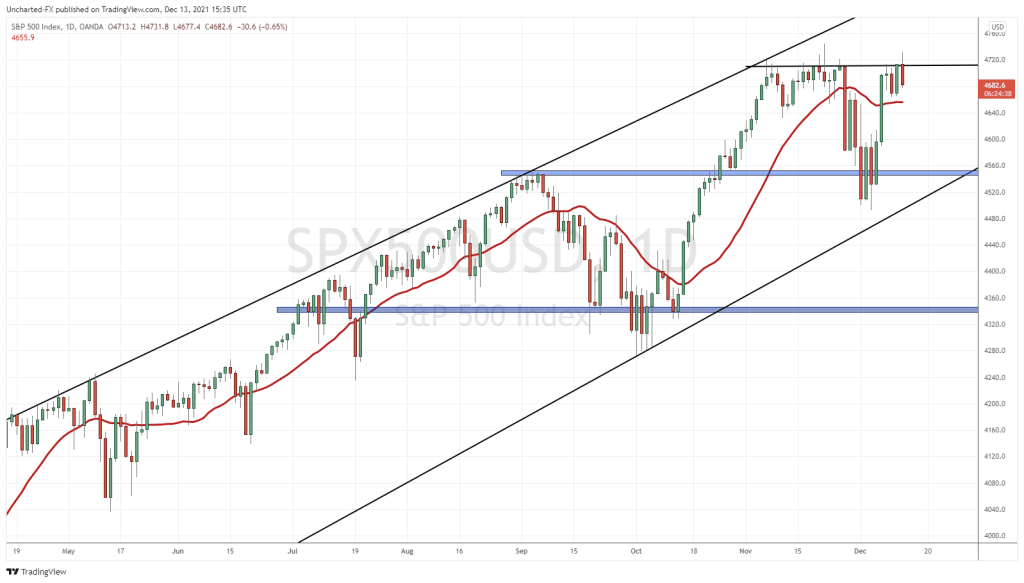
A major bear technical indicator has been invalidated, or neutralized, on the weekly stock market charts. This is known as a false breakdown, or a fake out. Some are already calling last week’s event a bear trap. Buy the dip is back baby!
Barring any sort of major black swan event, mainly anything on the geopolitical side of things, we should expect US stock markets to make new record all time highs.
Let’s start with the fundamentals first, but before we do, let me show you two markets that are printing new all time record highs already!


Both the Canadian TSX and the Norwegian OBX are printing new record all time highs. In the case of the TSX, a major range has been broken. Now it is all about the retest and the continuation higher.
Both of these markets are known for their heavy energy/oil composition. Thanks to oil breaking back above $110 a barrel at time of writing on March 21st 2022, the TSX and OBX are ripping into new territory.
Just a month ago, I wrote a technical piece titled “Make or Break Week for Markets“, where I detailed the major reversal patterns. For an international perspective, I did the same technical breakdown on non US markets. The TSX is the only market of the bunch that did not break down below a major support.
When it comes to WHY US stock markets will print new record highs, it comes down really to two things: inflation and cheap money. Inflation came in at 7.9% last month, and that was not accounting for the crazy rise in oil and food prices due to the current geopolitical tension. Inflation will continue higher because it is a monetary phenomenon. Money supply and velocity need to be reduced. Or, the Fed and other central banks will need to raise rates higher than the rate of inflation.
Neither will happen in my opinion because it would bring down the whole debt based economic system.
A lot of talk on the Fed raising rates multiple times this year…but if you look at stock markets, Gold and the US Dollar…those markets aren’t really screaming 6 rate hikes this year. In fact, I think markets are not expecting that many hikes this year. I am getting my signal from the debt markets:
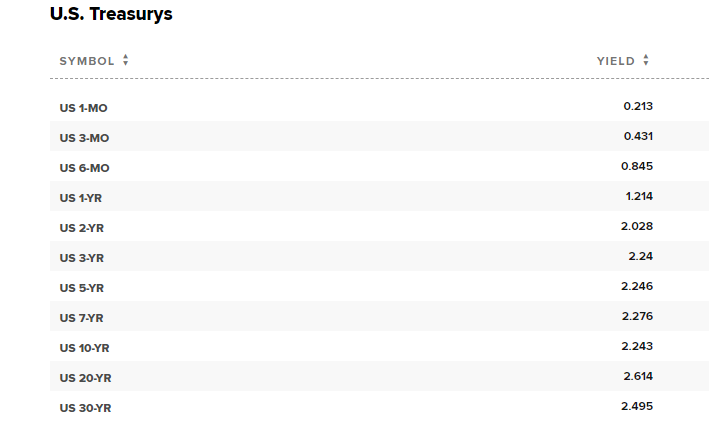
We are already beginning to see signs of the yield curve inverting, which is a sign that a recession is coming. The 7 and the 10 have inverted, and the 20 and the 30 have too. I keep my eyes on the 2 and the 10.
Seriously, there is so much debt out there that multiple Fed rate hikes could even cause a recession. So much so, that the Fed could even have to reverse policy earlier than expected. If this is the case, how can the Fed tame inflation?
The cheap money will continue and stocks will continue to gain a bid as they become one of the only places to go to make real yield. For this reason, stocks tend to do well in an inflationary environment.
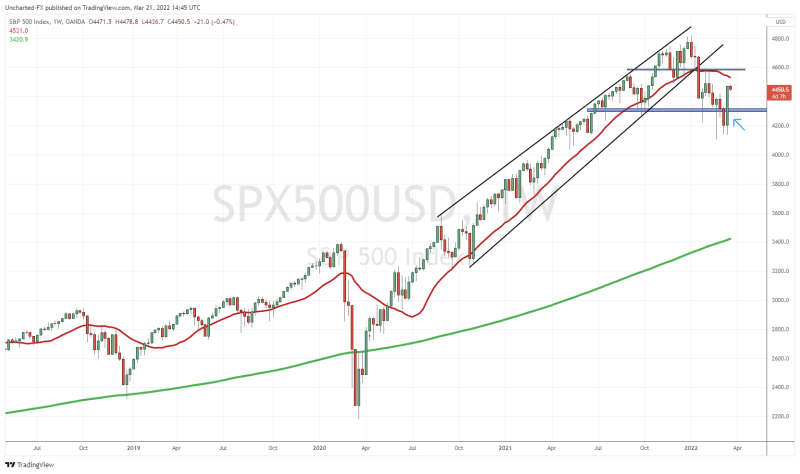
But now, let’s discuss the technical reason stock markets will make new record highs. As mentioned earlier, a bear market breakdown signal has been invalidated.

Two weeks ago we triggered a head and shoulders reversal pattern. It did not look good. But as we know with ALL breakouts and breakdowns, a retest always happens. Price pulls back to retest the breakdown zone which gives sellers another opportunity to enter short. Those who are short, have placed their stop losses above the breakdown zone. Previous highs and then new all time record highs come next.
Last week, the S&P 500 failed the retest. Great for bulls, bad for bears. We closed back above the head and shoulders neckline. 4300 now becomes new support.

For you traders out there, we even got a nice trendline breakout confirmed last week. Pullbacks just set up a higher low as long as the price remains above 4300. I have a long swing trade and will be looking to add to my position. Similar setups on the Dow Jones and the Nasdaq.

