
We have a tendency to just focus on US Stock Markets. Even though I am a Canadian, I tend to watch the US markets more. Can’t blame me though, I think the majority of the world does. However, it is prudent to keep tabs on what is happening in other global stock market indices.
I trade CFDs on indices, so I do trade markets in Europe and Asia. Stock markets nowadays tend to move in tandem together. But sometimes, China does its own thing. A few years ago, the big debate was what market leads? China or the US? This argument stems from the fact that Asian trading kicks off the week first, and then the US opens. But of course because of futures now, you can trade US markets before the Monday open. In the past, I have taken positions on the S&P 500 on a Sunday afternoon.
Still, some global market indices move due to other reasons, and can provide us clues to what may happen on US indices. My readers know that I have been warning of a weekly reversal head and shoulders pattern on US stock markets. We can see the same pattern on European indices…and there is one Asian market which actually triggered a breakdown a few months ago…
So let’s get down to it! A lot of charts that I want to show my readers!

Let’s start off with Canada. Above is the daily chart of the TSX. I wouldn’t say we necessarily have a head and shoulders reversal pattern, but we have reason to believe a reversal could be coming. However, the trigger for the breakdown is far away in comparison to US markets which are battling right at the breakdown zone.
We know there are three ways all markets move: uptrend, range, and a downtrend. We have had the uptrend, and we are currently in a range. What comes next on the breakdown will be the downtrend…and a new bear market.
It should be noted that oil and commodities are helping keep Canadian markets propped. Energy makes a large part of our index, and oil has been rising.

Sticking with the energy theme, above is the chart of the Norwegian stock market, the OBX25. Almost a carbon copy of the Canadian market. Similar structure. Norway is also big on oil, and higher prices have been keeping the OBX propped. So already two charts in and you guys are seeing the subtle differences in the petro markets.

Just for fun, and to indulge my conspiracy views for a bit, take a look at another petro heavy stock market. Above is the weekly chart of the Moscow Exchange. Russia’s stock market. Our key breakdown trigger actually happened in the week of November 15th 2021. Months before the Ukraine situation.
If you are a member of our Discord group, you may remember me warning about the plunge in EURCHF in Fall of 2021. To me, it was a sign that European wealth was running into Swiss bank accounts. There was no other news affecting the Euro or the Swiss Franc. That move coincides with the drop and breakdown on the Russian exchange. Maybe some of the Oligarchs were given the heads up?
For those wanting a positive, the Moscow exchange does appear to be testing a major weekly support now. Showing evidence of buyers stepping in with the large week on the current weekly candle.
Let’s look at a few other European markets.

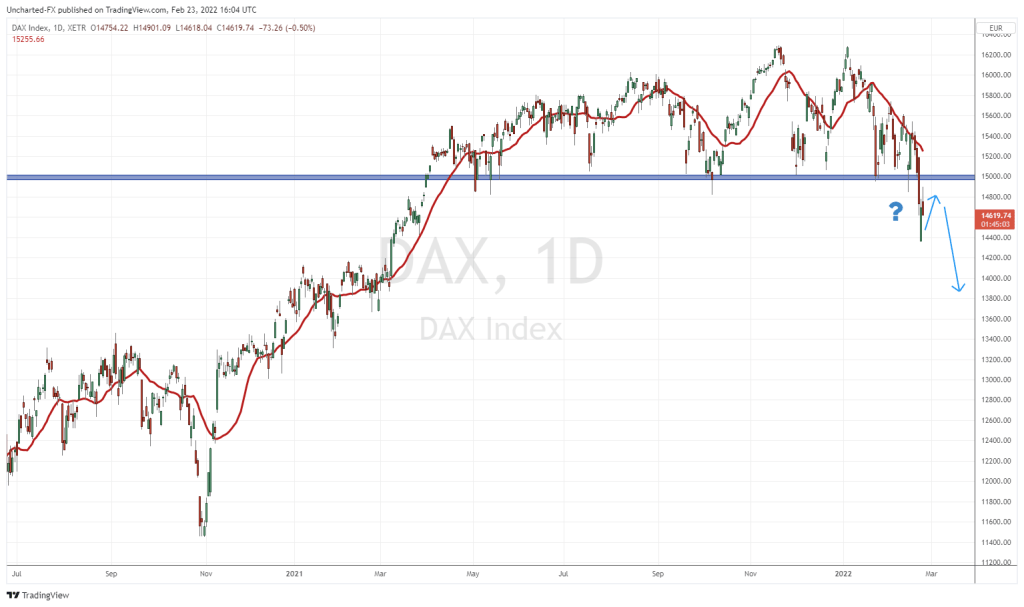
The German Dax is at the top of the list for a short. We actually confirmed a breakdown this week on Monday. I have drawn in the retest lower high trajectory. This could be happening right now! Basically, as long as we remain below 15,000 on the Dax, the downtrend can continue. Our first major market with a major breakdown confirmation. What would add more fuel to the fire is a weekly candle close below 15,000! Could happen this week!

Over in the UK, the FTSE is also looking weak. It looks like we are in the early stage of forming the right shoulder in a head and shoulders reversal pattern. I have drawn in a trendline with multiple touches as well. In lines up close to our support neckline. If you are bearish global markets, the FTSE might be the one to front run.


Two for one above! The French CAC and the Italy40 both are testing the neckline support. You see what I am seeing? Yes. Those head and shoulder patterns. Yikes. We can maybe confirm the break this week.
In summary, the German markets have confirmed the breakdown…and is waiting for other European markets to follow. Watch that 15,000 zone!
Let’s shift now to Asia!

The Japanese Nikkei on the weekly chart has been ranging pretty much for all of 2021. The new year actually came with a breakdown. Since then, we have pulled back to retest the breakdown zone, and so far, sellers are piling in. All that is required for more downside is a confirmed weekly close below recent lows.
It looks bearish folks. For a longer swing trade, shorting the Nikkei is very attractive, while nestling the stop loss above 27,900. We could be even for a deeper move lower to 24,000!

Over in China, I have been watching the Shanghai Composite Index for some time. I have been watching for either a huge breakout above resistance at 3710, or a break below 3360. Those are the two key levels. China remains in a range, and has bounced from support even with Evergrande and other real estate headlines. China is also one of those markets that just ranged for the entirety of 2021.

I want to end with a market not watched by many. The KOSPI, or the South Korean stock market. I noticed a slanted and broad head and shoulders pattern last year. We actually broke below the neckline, and technically, can make a further move lower.
What makes the KOSPI important is that the Central Bank of South Korea was one of the first to begin raising interest rates to combat inflation. The market fell on a hawkish central bank. Could provide us with clues on how the US markets, and others, will react when interest rates begin to rise. But as you can see, the Asian markets are a bit more tame compared to US markets.
I hope this was helpful. The takeaway is that global markets are showing signs of reversal. Lots of charts setting up nicely, and just require the breakdown trigger for confirmation.