Tesla Stock (TSLA) has fallen for four straight days in the past two weeks, with market analysts predicting the stock to enter its third bear market in 2021. We can say for now, this has been avoided, and I will explain why on the charts in just a minute.
So let’s first define the street’s definition of a bear market. Many on Wall Street define a bear market as a decline of at least 20% from a recent bull market closing peak, and some say that bear market would end after a 20% rally off the subsequent low.
Tesla’s stock was trading 20.7% below its Nov. 4 record close of $1,229.91, and a bear market would become official to some technicians with a close at or below $983.92. Earlier this year, stock entered a bear market on Feb. 23, 2021, when it closed that day 20.9% below its then-record close of $883.09 on Jan. 26. That bear market bottomed on March 8 at $563.00, or 36.2% below its previous peak, before rallying as much as 35.4% to April 13 closing high of $762.32. The next bear market started in May, and bottomed on May 19 at $563.46, or 26.1% below the April peak. The current bull market started on June 24.
Two key fundamental news to help drive the stock lower, but I would stress, to watch the overall markets too. But the first big news is of course Elon Musk selling nearly $11 Billion worth of shares since November 8th 2021. He says its for tax reasons. Others like Dr. Michael Burry believe he owes others money. And then we need to add in Musk’s recent comments regarding SpaceX potentially going broke. Maybe he is getting some cash to put into SpaceX. The other option is to take SpaceX public…which probably does happen eventually.
The second large piece of news which helped drive the stock lower on Friday was related to the SEC. The Securities and Exchange Commission opened an investigation into Tesla over whistle-blower claims on solar panel defects, citing a letter from the agency. Reuters reported that the Securities and Exchange Commission had opened an investigation over a whistleblower complaint that the company failed to notify shareholders and the public about solar panel defects. Let’s not forget that the company’s Autopilot system is also the subject of an investigation by the National Highway Traffic Safety Administration.
Let’s take a look at what’s happening on the chart:

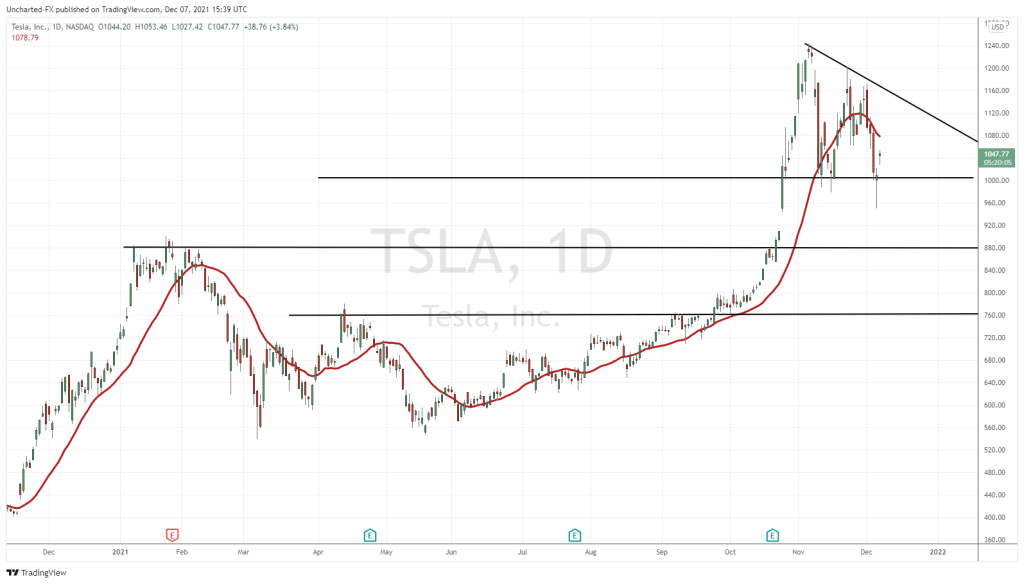
I like the technicals on this. Clean and simple. While everyone was talking about the new bear market, I was watching the daily chart at this major support zone. I am talking about the $1000 support zone, which turns out to be a major psychological support zone. Notice how yesterday’s candle looked really gnarly. It was full blown red at one point, with price hitting lows of $950.50. Tons of new retail traders were eager to FOMO and sell. My readers know my approach: be patient and await confirmation. If Tesla closed below $1000 on the daily chart, the short would trigger, and we would be heading lower to support at $880.
Instead, we turned around and reversed to form a hammer like candle with a large wick. Bears were REKT, but more importantly, we closed back above $1000 neutralizing bear market fears for now. Watch major support and resistance zones on the daily chart. You see price action like this. Experienced Wall Street traders know these areas attract a lot of retail money. In my 8 years of following markets, I see these types of shenanigans happen all the time… and way too many calls from friends trading markets saying why did price reverse so hard, and me explaining price was at a support zone. The test of support is not complete or broken until we get the confirmed candle close!
Going forward, Tesla remains alive above $1000. I have drawn a trendline above which has three touches so I think it is valid. Use it as resistance for capping price. Almost a triangle pattern setup, with a close above taking us to new record highs. Alternatively, if we close below $1000, then we have major support at $880 and then $760 if that breaks.
Before you go, a quick peak at the Nasdaq:

I spoke about this over on Equity Guru’s free discord trading/investing channel. The Nasdaq was retesting a major support zone. What was once resistance became new support which we did not retest after making new record highs. Typical breakout price structure tends to see prices pullback to retest new support. Sometimes this happens right away, sometimes it takes a few weeks. While analysts have been saying a market crash, so far to me, this has just been a pullback to support. That’s it. With the Nasdaq catching a bid, and all other markets doing the same, the Santa Claus rally may take us to new record highs by the end of the year.