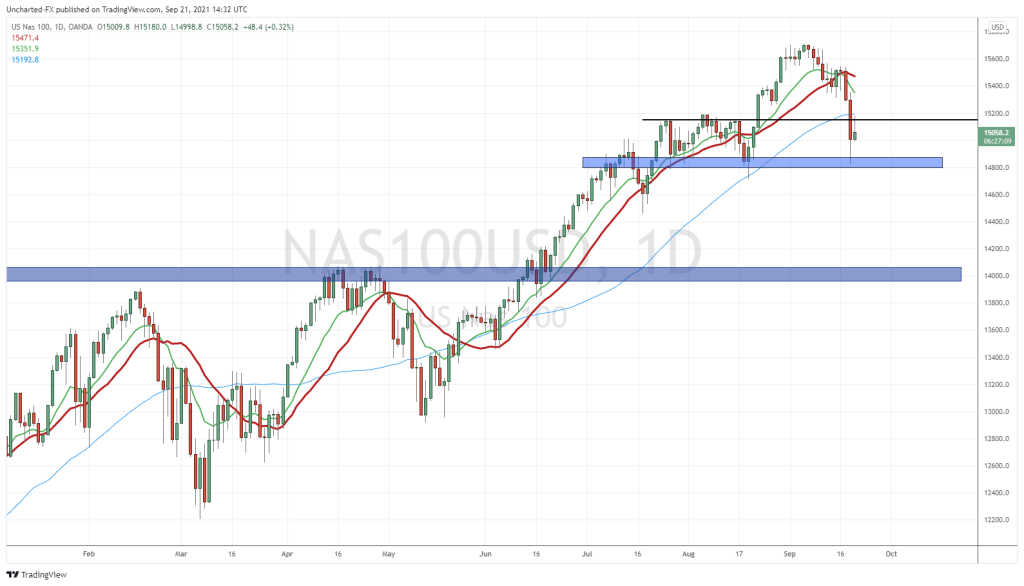
Our technical analysis from Monday’s Market Moment article has all triggered. The reversal patterns hinting at localized highs have played out. and it does not appear as if we will get a Santa Claus rally this year.


Both the S&P 500 and the Dow Jones have triggered head and shoulder patterns. As long as the price remains below our breakdown zones (the black line) then the downtrend is in play. A positive for bulls is that we may just range here rather than sell off hard. We did see a retest of the breakdown zones yesterday which saw a major sell off. Only to be bid up near the end of the trading day.
So we have a breakdown. The technicals are in line. A couple of other things to look at would be the US Dollar and the 10 year yield.

The Dollar seems ready to reverse as a basing is occurring here. This would put pressure on stock markets.

The 10 year yield is rising thanks to the Bank of Japan. What they have done will have ramifications for the credit markets and I would be watching these markets in the next few months. Yields are rising, but currently, this would be classified as a pullback in a new downtrend. We would need to close above 3.9% to nullify the downtrend and spook markets.
But there is one other chart that I am watching currently and that is the chart of Apple.
Why Apple? Well, the tech company dominates the S&P 500.
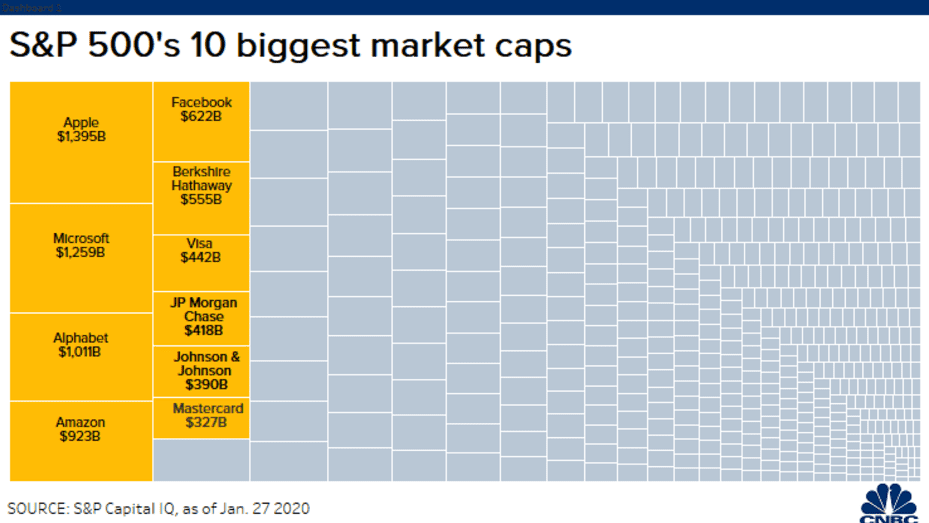
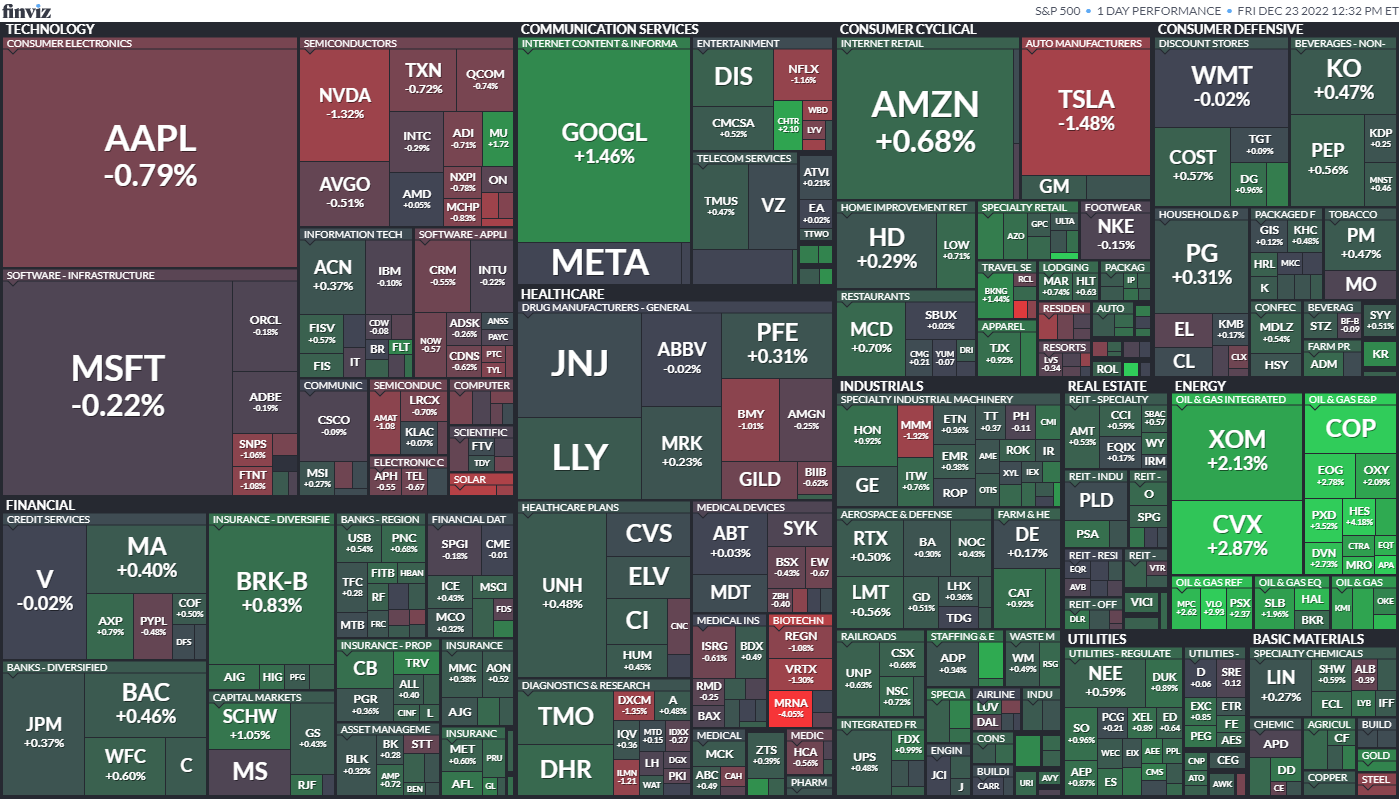
Alongside Microsoft, Alphabet, Amazon and Meta, these five companies make up 17.5% of the S&P 500.
While many people are looking at consumer spending during Christmas to affect corporate earnings, Apple stock could see issues not only with sales but also due to the current situation in China.

Above is the weekly chart of Apple (AAPL). Now this meets my reversal pattern criteria. But there is one crucial thing lagging. The actual breakdown trigger. For this, we need to see a weekly candle close below the $130 zone.
If we don’t get that close, the stock could just bounce from here and head higher. However, I saw this bounce already occur back around early October 2022. We did not continue the momentum, and instead, are back down to the key support zone.
Things look bearish. Because this is the weekly chart, we must wait for the candle to close on Friday (the end of the trading week) to confirm the breakdown. There is a real chance we could see this breakdown by the end of this year.