After a sell off in Stock Markets with a down day not seen since May in terms of points, Stock Markets provided some relief overnight. As we expected and outlined in one of our scenario’s in yesterday’s piece. Stock Markets are still in danger of making another lower high swing. I have spoken about the S&P 500 a lot, but today I want to focus on the Nasdaq.
Before we begin, a reminder: a big Fed day tomorrow AND the People’s Bank of China has an interest rate decision. The latter taking more significance given the Evergrande woes. We have just heard that Evergrande missed debt payments to at least two banks. Not looking too good. The world today is different than that of 2008 when it comes to markets and central banks. Central Banks are more involved and will do anything and everything to keep liquidity and markets going. The Evergrande situation will be solved no doubt. Some sort of bail out or restructuring. The big debate is whether this will be a ‘hard landing’ due to China wanting to deleverage in order to prevent a larger credit crunch down the road, or a soft landing where everything resumes as normal, and no contagion issues impacting world markets are set off.
Barclay’s bank refutes the Lehman comparisons many are using:
“China’s situation is very different. Not only are the property sectors’ linkages to the financial system not on the same scale as a large investment bank, but the debt capital markets are not the only, or even the primary, means of funding. The country is, to a large extent, a command-and-control economy. In an extreme scenario, even if capital markets are shut to all Chinese property firms (which is not occurring and is only a tail risk at this point), regulators could direct banks to lend to such firms, keeping them afloat and providing time for an extended ‘work-out’ if needed. The only way to get a widespread lenders’ strike in a strategically important part of the economy would be if there were a policy mistake, where the authorities allow the chips to fall where they may (perhaps to impose market discipline), regardless of the systemic implications. And we think that’s very unlikely; the lesson from Lehman was that moral hazard needs to take a back seat to systemic risk.”
On the other side, we have Uday Kotak, one of the worlds richest bankers and CEO of Indian lender Kotak Mahindra Bank:
Evergrande seems like China’s Lehman moment. Reminds us of India’s Infrastructure Leasing & Financial Services Ltd (IL&FS). Indian Government acted swiftly. Provided calm to financial markets. The Government appointed board estimates 61% recovery at IL&FS. Evergrande bonds in China trading ~ 25 cents to a $.
Take your pick.
There is an on going debate between fundamental vs technical analysis. I think it is important to watch the technicals because fundamentals are priced in sometimes weeks before. Fundamentals are lagging. Truth is we live in a world of imperfect information. I find that by looking at the technicals, one can actually predict news events, data points, and market cycles because those with information are placing trades before these events occur. For more on this debate and the availability bias check out this short Youtube clip by Alessio Rastani:
Market wise, we have broken below the 50 day moving average (MA). This is mostly used for swing trading, but is watched by financial pundits and traders alike. Very simple: if price is below the 50 day MA, price action is bearish. If price is above the 50 day MA, price action is bullish.
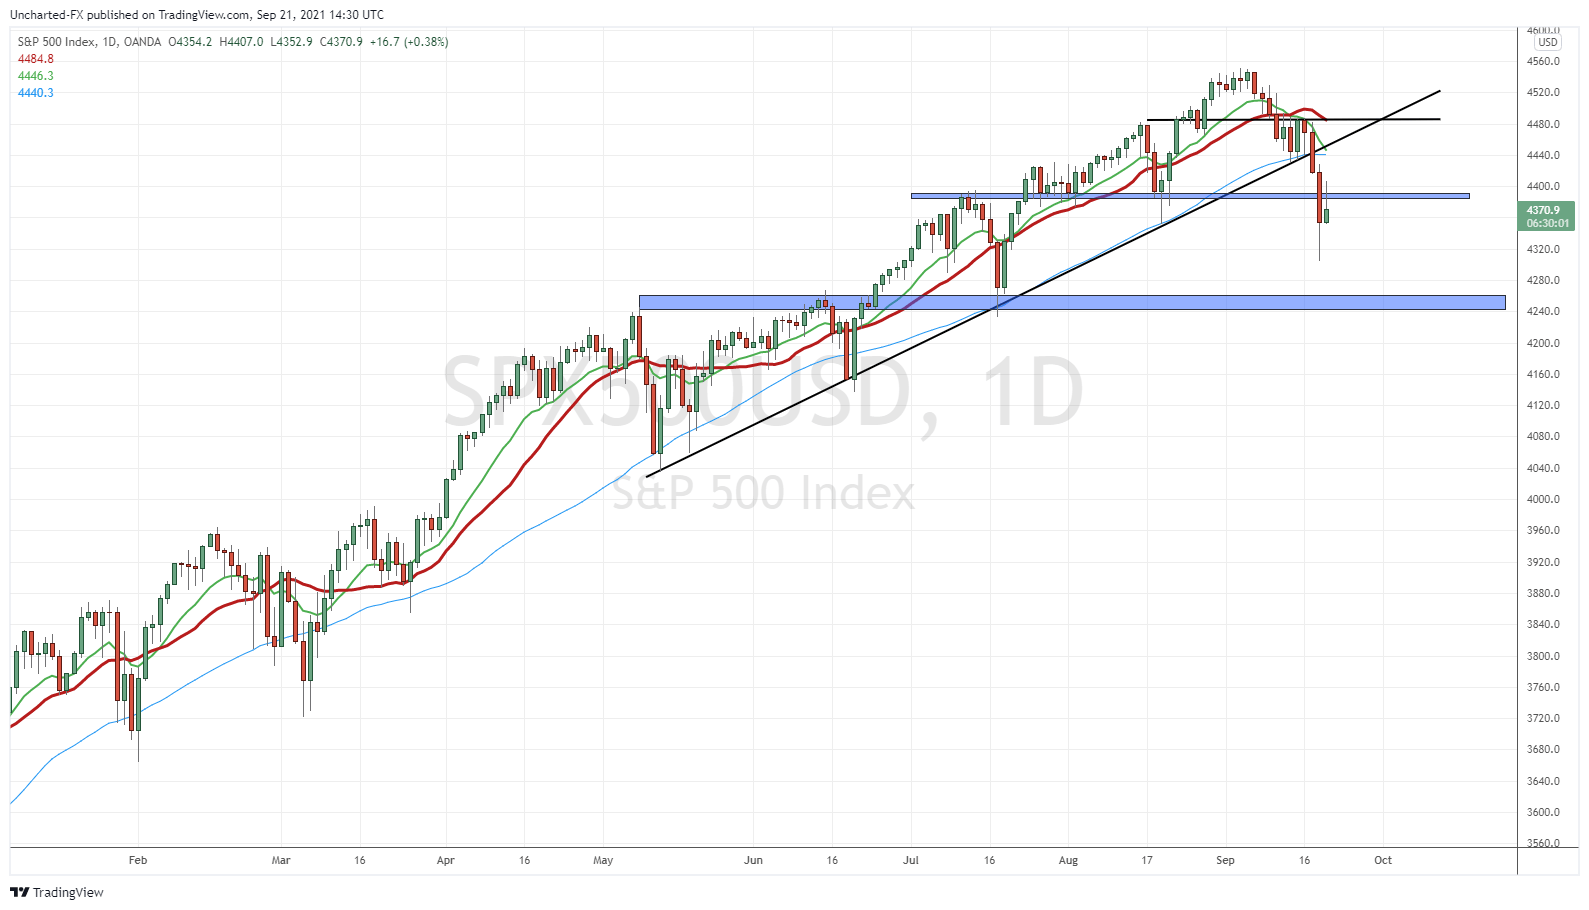
Above is the chart of the S&P, and I want you to focus on the light blue MA. That is the 50 day MA. Notice price action on the close last week Friday. Then the dump on Monday. Of course I like to look at my other technicals such as the trendline and support and resistance. But the key take away is that market pundits are bearish. The break below the 50 day MA means further downside swings can occur. In order to nullify their bearish stance, they want to see price close back above the 50 day MA. Which coincidentally, lines up with my trendline break.
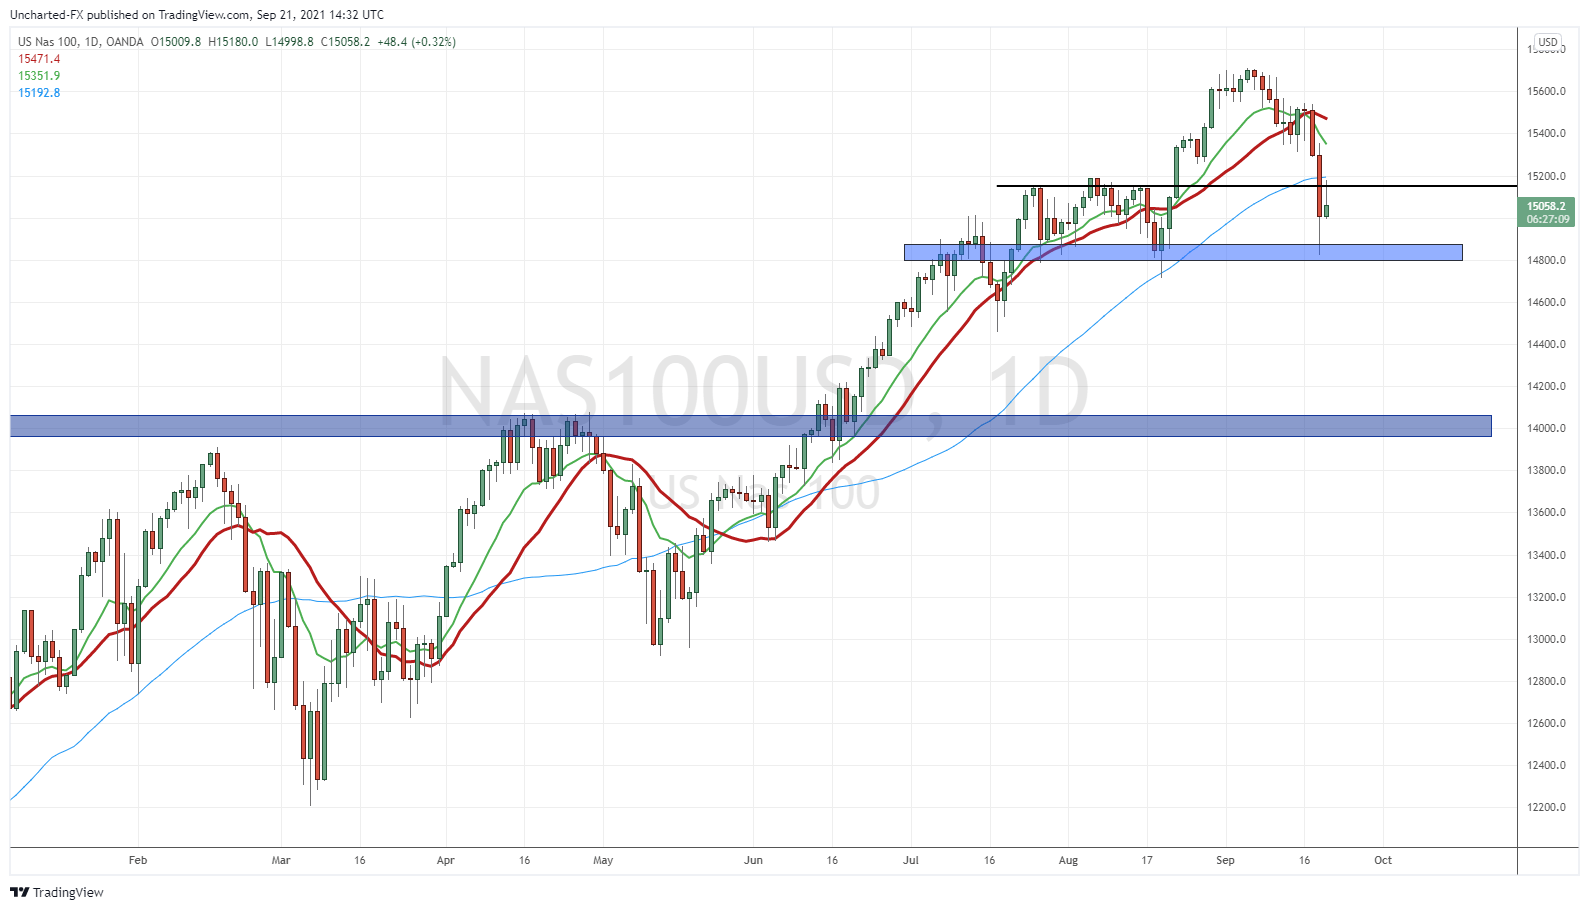
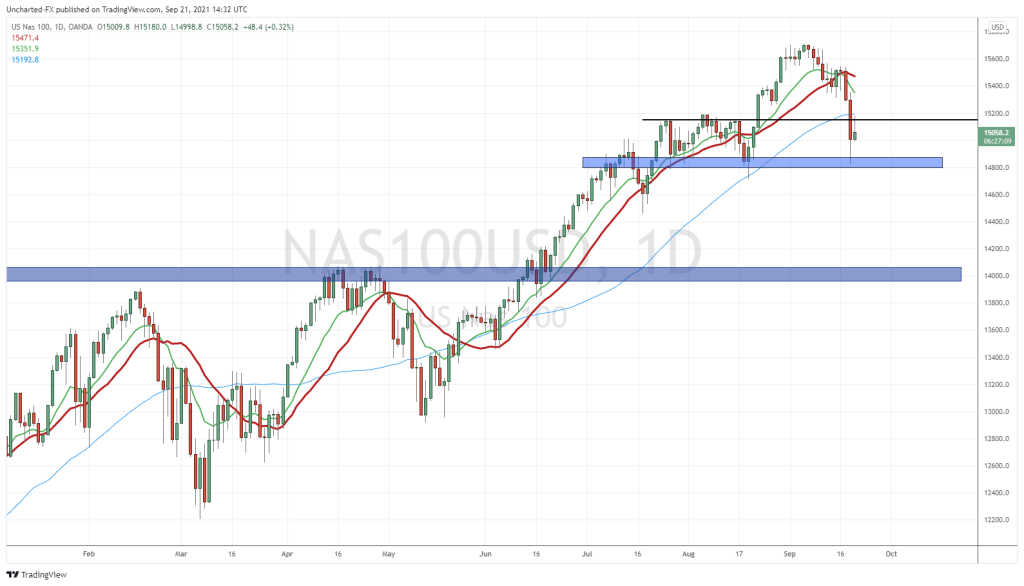
Now the Nasdaq. Notice how we broke below the 50 day MA yesterday. Also note how overnight price action, and today’s price action saw us REJECT the 50 day MA on the bounce. However, it also was a retest rejection. I highlighted this in yesterday’s post with the S&P 500. If the support at around the 4390 zone is broken, it now becomes resistance. Breakdowns tend to see a retest of resistance before continuation. At the time of writing, we are seeing a nice rejection on the retests, which keeps the possibility of further downside open. Powell and the Fed will give us more direction.
The same retest is happening on the Nasdaq.
Now, let’s talk about fear.
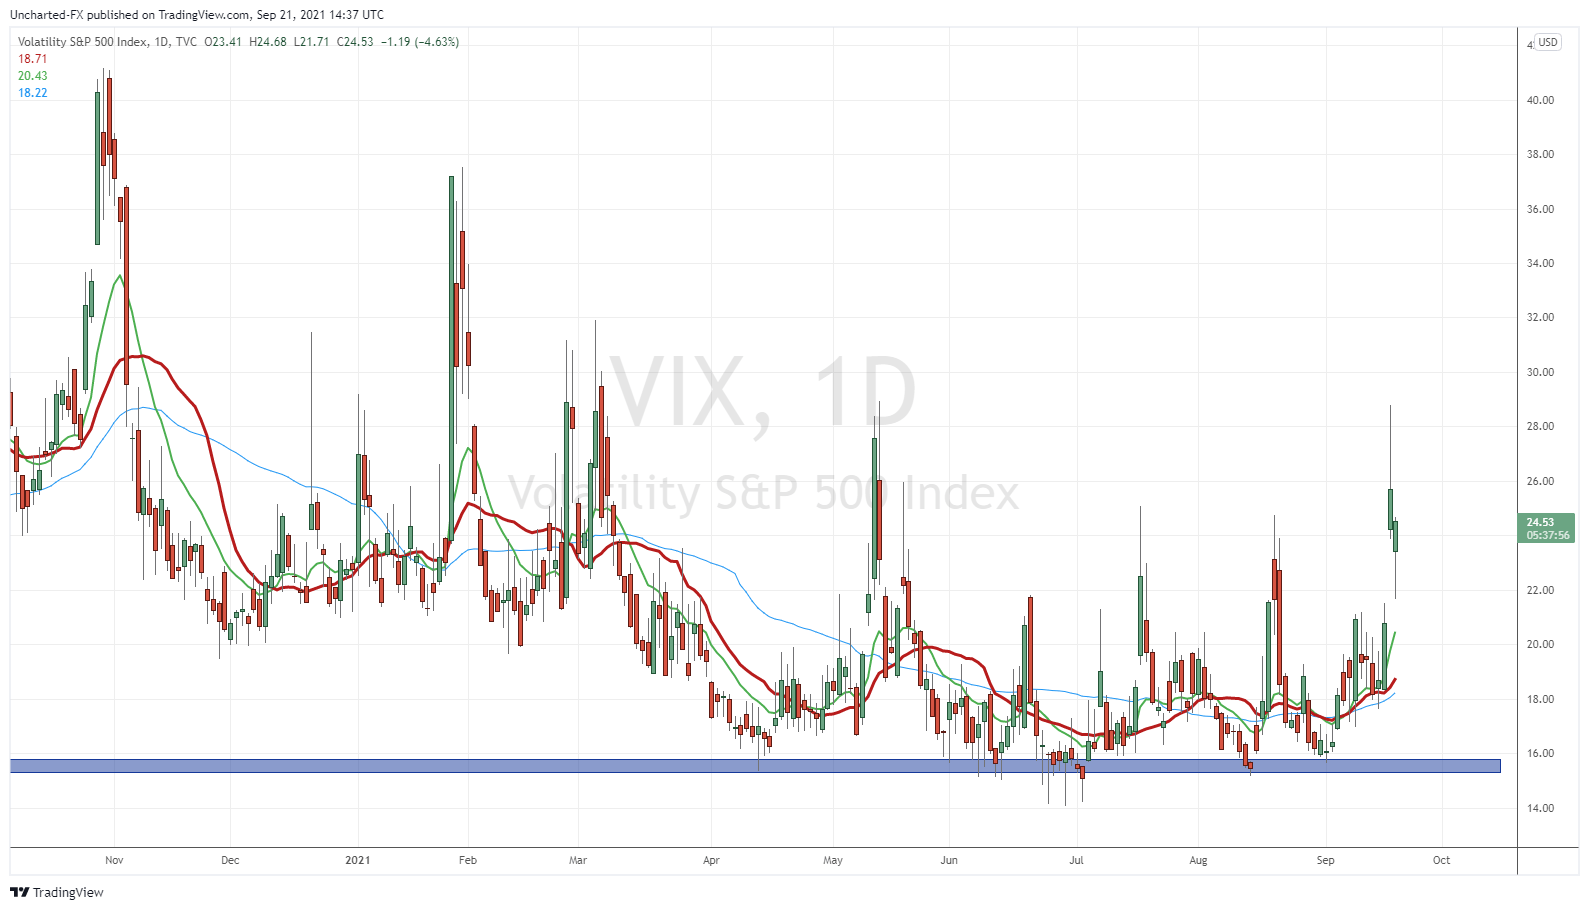
With the VIX rising, the Dollar rising, and let’s keep our eyes on Bonds and the Japanese Yen, we can gauge fear in the markets.
With fear, money runs for those safety trades…and also runs into value stocks. Good companies that have been around for a long time and pay dividends. Growth stocks tend to sell off hard. We are talking about the Nasdaq.
Watch the price action on Apple and Tesla. Both impact the Nasdaq in a big way.
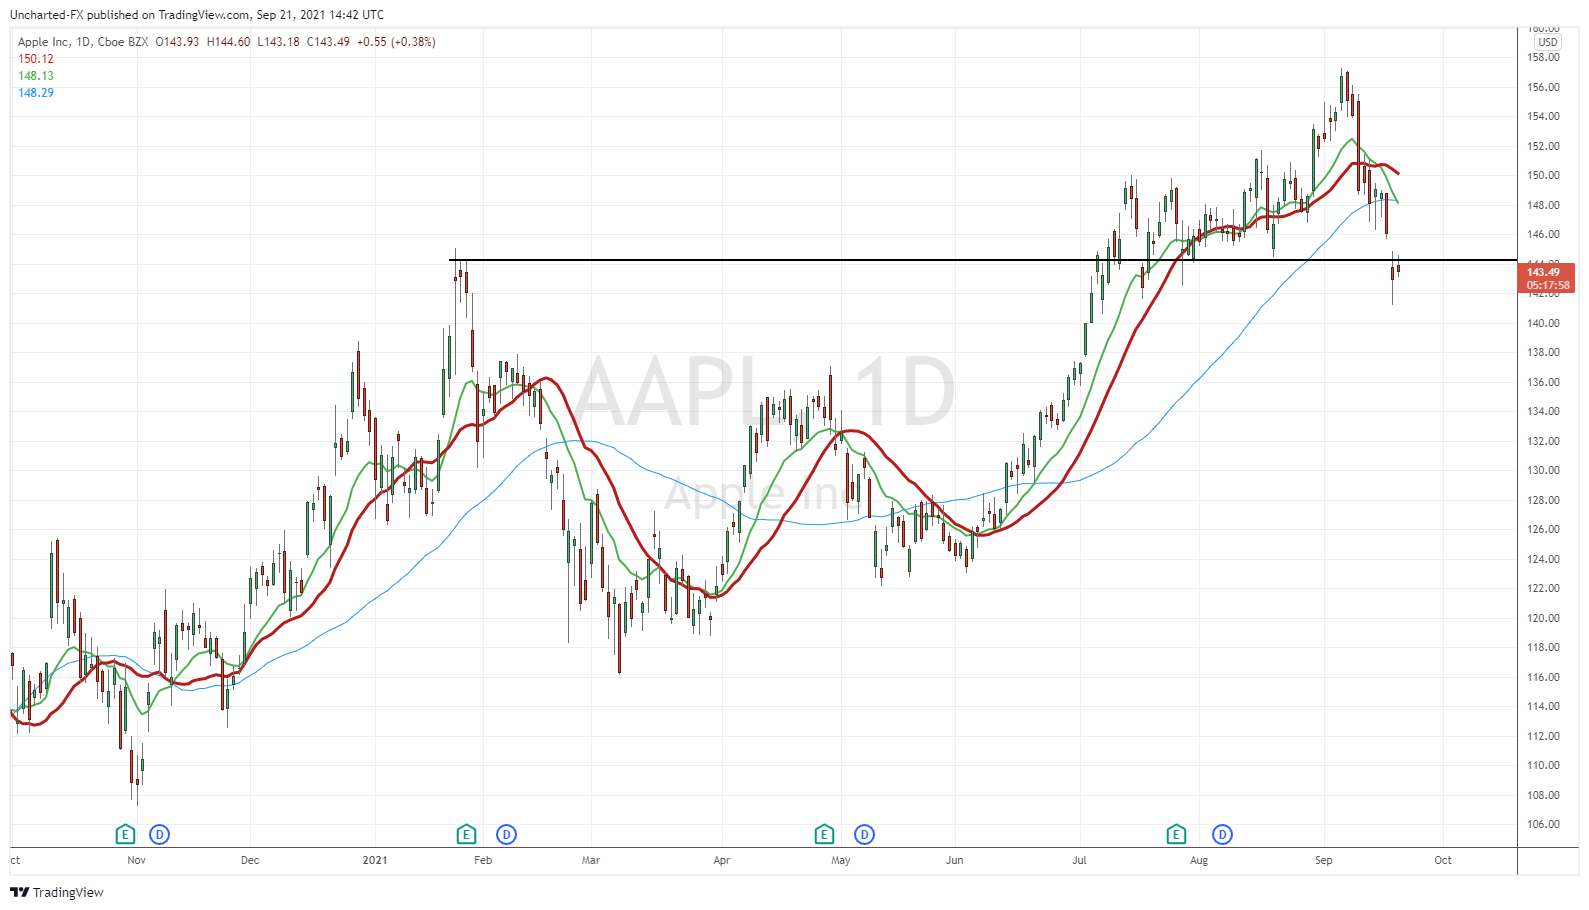
Apple broke down support yesterday, and is now testing what was once support as resistance. If we hold below, another leg down is possible. Even taking us down to $136.
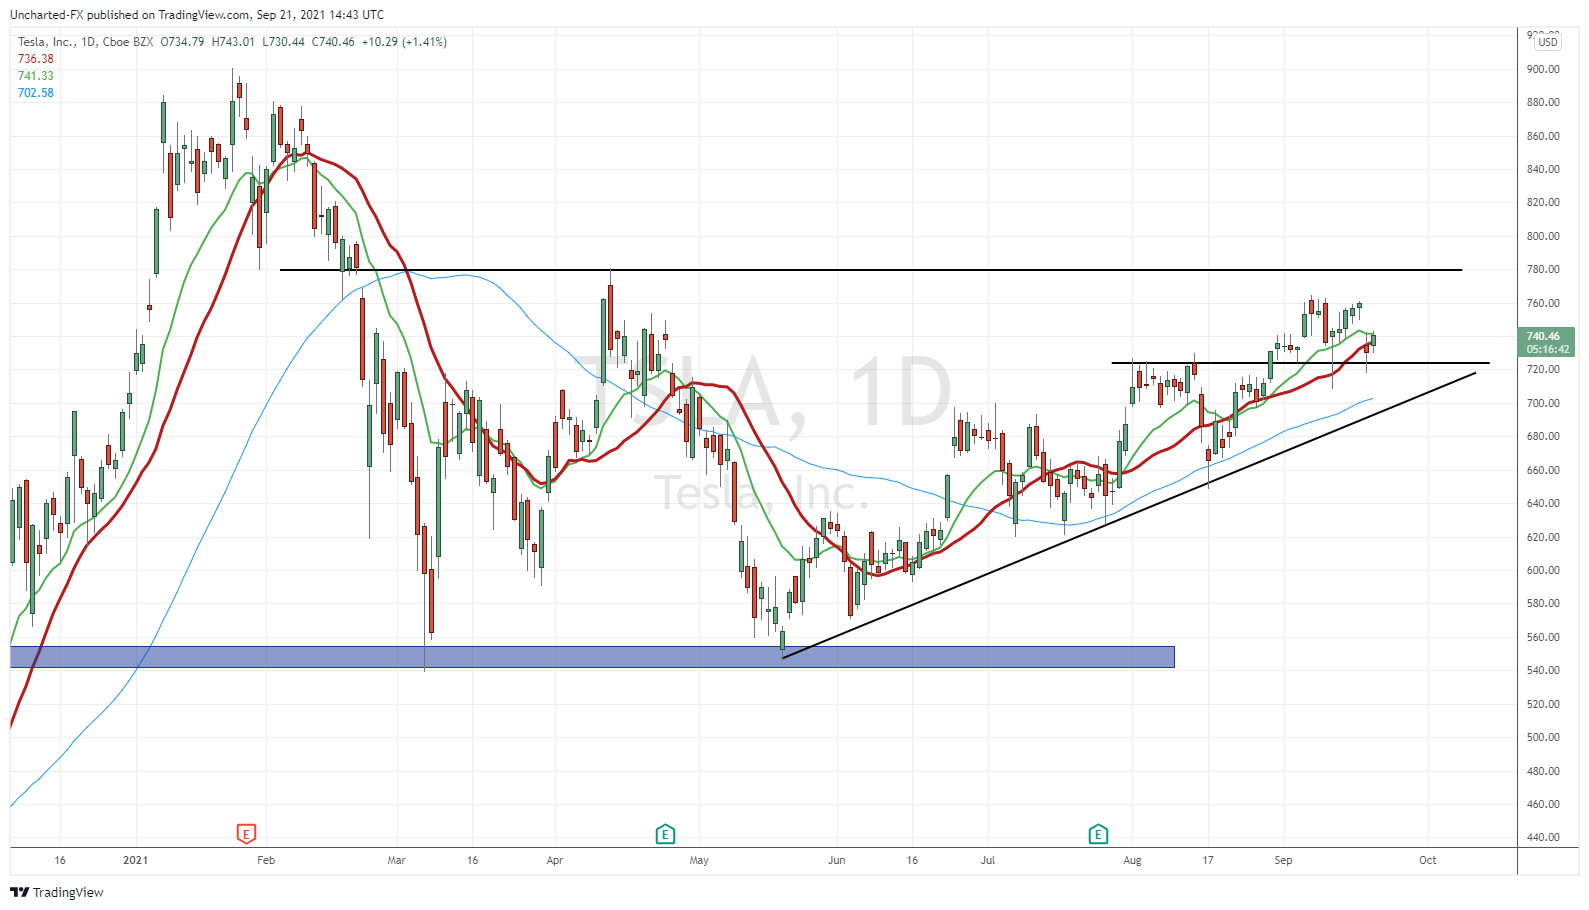
Tesla is still holding up. A nice uptrend and above $720 support. Although this one has been moving slowly than before. Just not too fun to trade anymore. A slow and steady gradual rise with a lot of ranging in between.
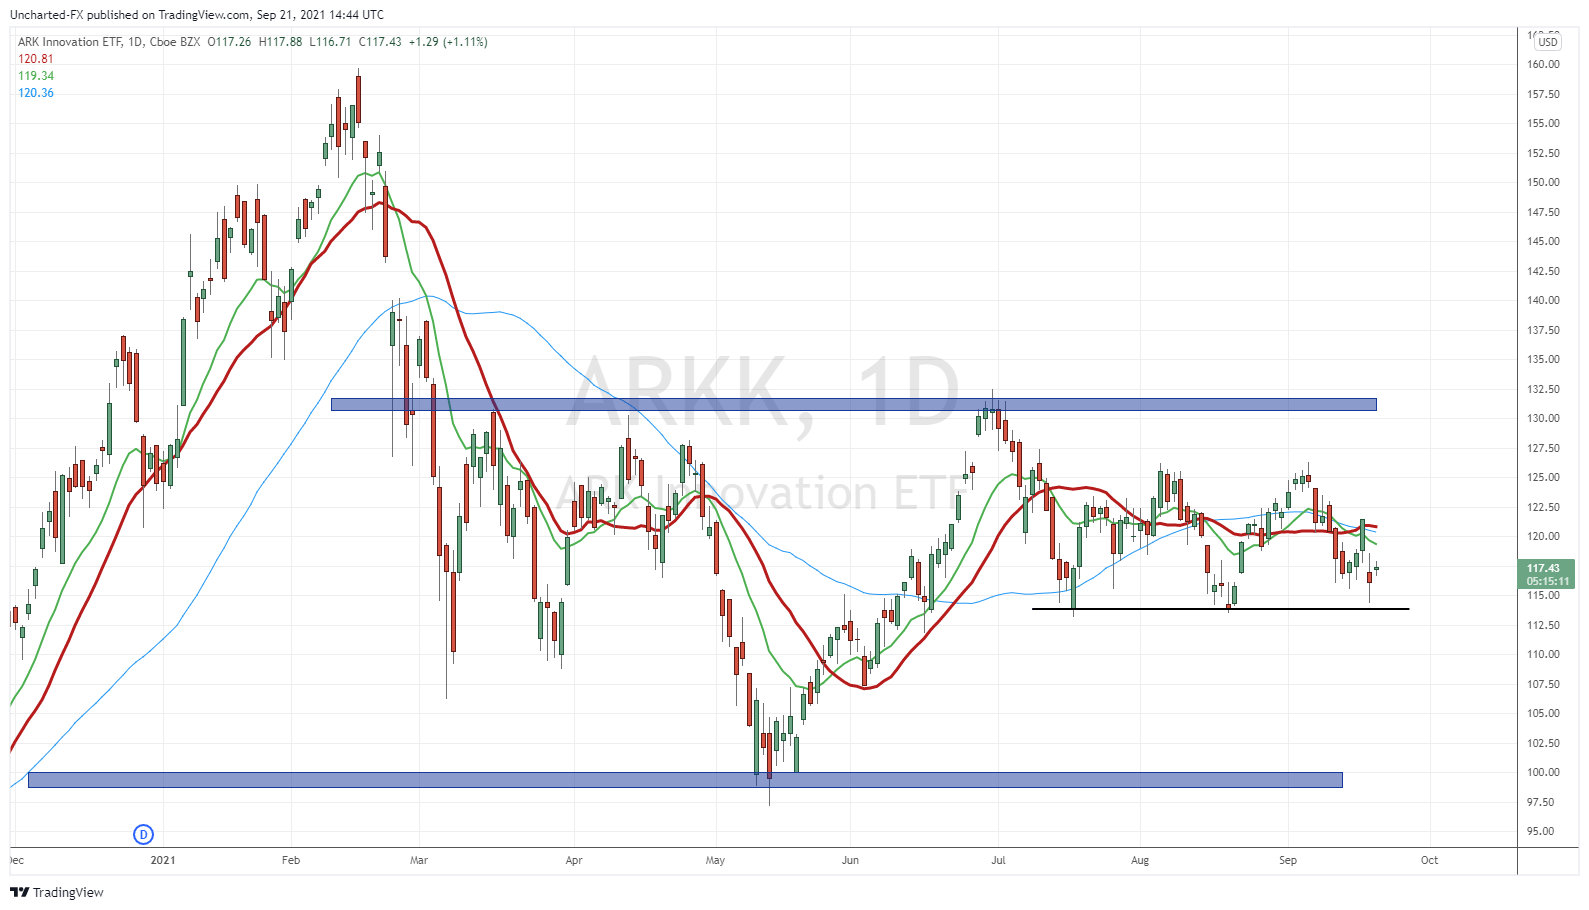
If the Nasdaq continues to drop due to an overall market sell off, ARKK will be on the list for many short sellers. Well, it already is on Dr. Michael Burry’s list. ARKK has just been ranging. Support at around the $114 zone is holding…for now. A break below and we can tumble back to $100.
So in summary, a key MA level has been broken, and markets are currently retesting the breakdown down. This was expected and is just normal market structure. I expect today to be a day of range and consolidation. All about the Federal Reserve tomorrow at 11 am PST. Does the Fed continue the taper rhetoric and perhaps cause a market sell off in the form of a taper tantrum? Or does the Fed backstop markets by addressing concerns in China? For those that believe the Fed cannot taper and cheap money is all that keeps markets and assets propped, China provides a great excuse for the Fed to save face.
The excuse will be, ‘oh we were ready to taper but then this happened which was out of our control’. To be honest, we have already seen this a few times with the variants. This China issue fits the bill. All playing a role in the transformation of the Fed becoming the buyer of last/only resort and becomes the most powerful institution in human history.