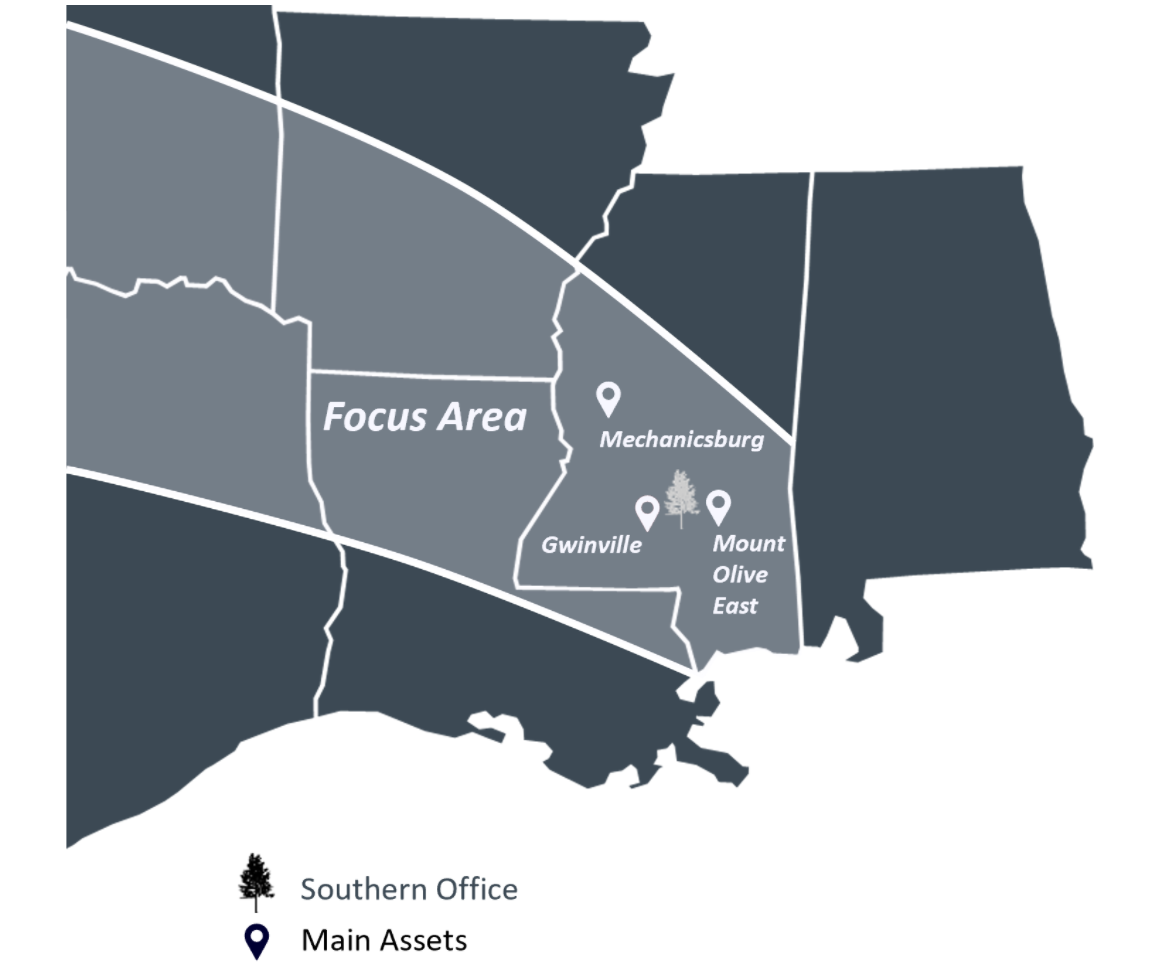
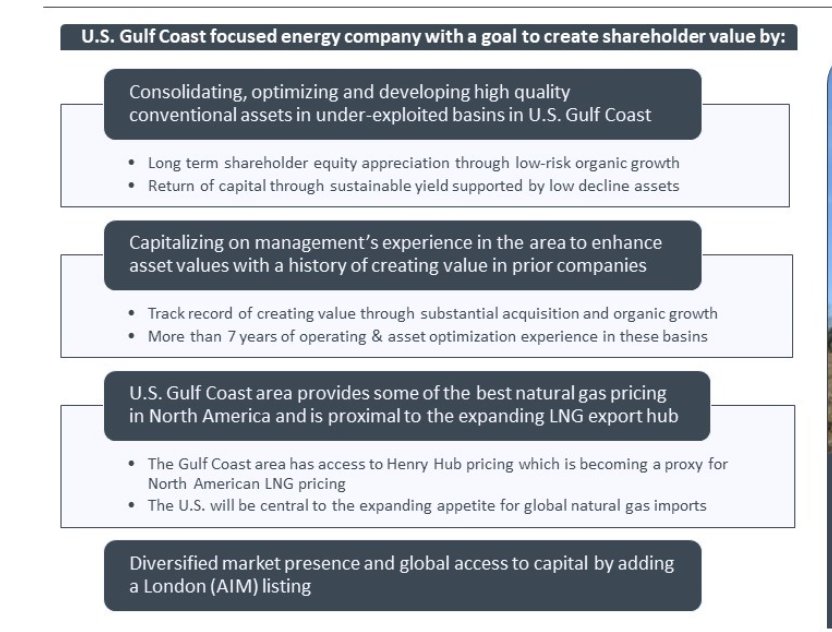
Southern Energy (SOU.V) is a natural gas exploration and production company. Southern has a primary focus on acquiring and developing conventional natural gas and light oil resources in the southeast Gulf States of Mississippi, Louisiana, and East Texas. Its principal properties are Central Mississippi Assets that covers an area of approximately 31,000 acres containing oil and gas production at Gwinville, Mechanicsburg, Williamsburg and Mount Olive, and Mississippi.
The company’s strategy is very simple: use management’s expertise in the South Eastern Gulf Coast area to add proven developed producing assets and execute low risk development drilling to achieve growth in reserves. The end goal is to build a high-margin asset base of sufficient scale with significant low-risk drilling inventory that continues to generate cash flow.
It is definitely the right time. Energy has been hot. Following the markets regularly, nobody has really been talking about the sector until now. I have always been bullish Oil for inflationary reasons. Commodity prices will continue higher as money runs to hard assets. There is also the geopolitical side with OPEC Plus. We saw the Oil war President Biden began. It looks like he failed, but the US and other nations released reserves to try and bring the price of Oil down. Shift the supply side of the equation. President Biden wanted OPEC plus to cut production, but it doesn’t look like Russia or Iran want to do the US any favor. It should be noted that Mohammed Bin Salman and President Putin have been getting along quite well. This could lead to some major shifts in the future when it comes to Saudi and US relations. The Saudi’s may just look at Russia for military protection.
I think it is prudent to have some Oil exposure in your portfolio. If you don’t want to listen to me, just listen to fund managers who have come out saying energy is the best opportunity for 2022 in the last few weeks. One recent bull was Jeff Currie, Goldman Sachs head of commodities research. He believes the energy market will continue to get tighter over the next three months.

XLE has broken out, and the market structure looks very similar to our InPlay Oil (IPO.TO) analysis just put out two days ago. The same flag patterns and continuations. A lot of Oil stocks look like this. Breaking out. Why is that?

Oil continues its move after breaking out above $75. Our technicals are playing out and we remain bullish on oil. Once we take out recent highs of $85, the financial media will be reminding people of the $100-$125 2022 target put out by major banks.

Natural Gas is what I am keeping tabs on. If you are a member of Equity Guru’s Discord channel, I told members that Natural Gas broke out a few days ago. We went long. The profits we have made so far are my best for 2022. But we are still early in the year and looking forward to more gains. Natural Gas is testing a resistance zone, but I think we are due to make another leg higher. We remain bullish above $4.00. In seasonality terms, the next two months should be positive for gas.
The charts of energy look great, and if you want to play this sector, what better place than picking up companies on the TSX, which is dominated by energy.

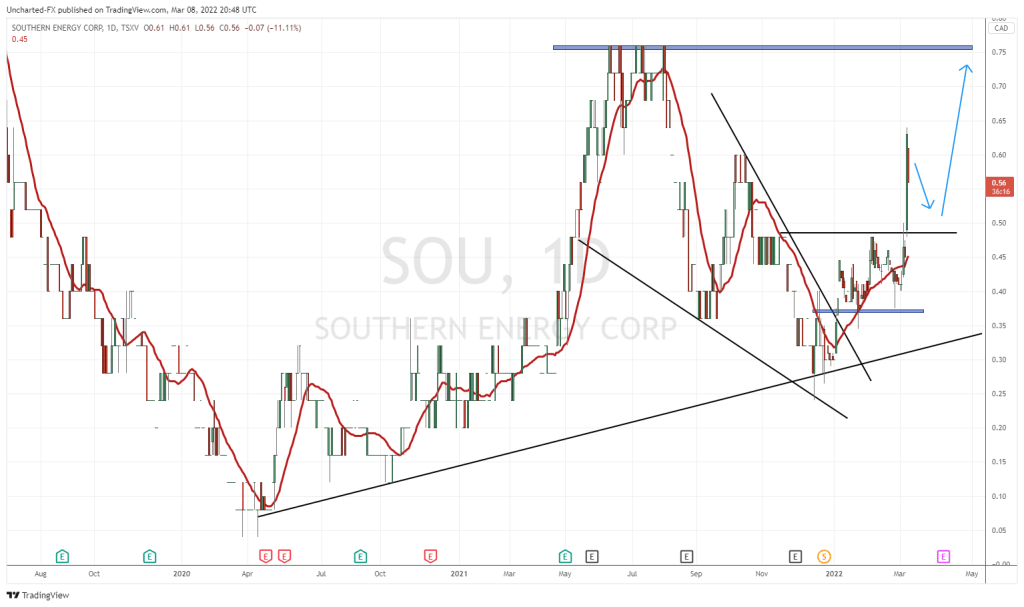
Southern Energy broke out of a wedge pattern and gapped up the day after. Since then, we have yet to follow along with the overall energy bull run. Investor’s are looking forward to the drilling which is funded with a US $12 million equity financing. Shareholder’s are excited by this, but also due to the insider trading, the low float, and the possibility of being debt free by the end of the year. 2022 will be a big year for the company.
Technically, the stock could pullback to retest the wedge breakout before continuing. As I am writing this article, the stock actually did see a large amount of shares traded at $0.40. The last two days have seen higher than average volume. With Oil and Natural Gas making major moves, it is a high probability that Southern Energy sustains this wedge breakout and continues higher. The two ways to enter would be here at the retest, or await the break into new recent highs with a candle close above $0.445.
I should also mention there is a gap between $0.40-$0.415. Gaps act as support, however a gap fill, meaning a daily candle close below the gap, would be a bearish sign. Southern Energy is seeing buyers bid at the gap. Good news for bulls. Watch the price action here especially if Oil and Natural Gas sustain their moves.


