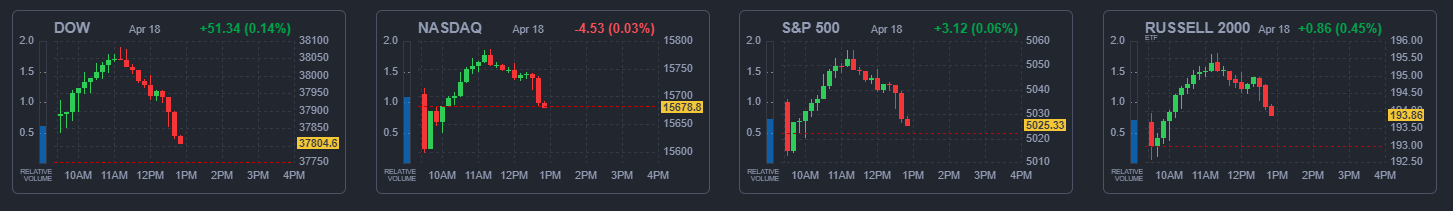
At time of writing the US stock markets are green for the day in an attempt to end four red days in a row. However, the green is slowly dissipating with a sell off. In fact, the Nasdaq has already gone red.
My readers know that I like to rely on technicals. We will get to the charts, which do show weakness. But before, let’s look at the fundamentals moving the markets.
The current market narrative is all about interest rates and inflation. This year so far has all been about, “when is the Fed about to cut rates?”. March cuts moved to May and then June, and now Fall 2024.
Inflation has surprised and has begun to uptick. March CPI came in at 3.5%, higher than the 3.4% expected. The annual core CPI, which excludes volatile food and energy prices, rose 3.8% in the same period, matching February’s increase. On a monthly basis, the CPI and the core CPI both rose 0.4%, compared to analysts’ estimate of 0.3%.
“The recent data have clearly not given us greater confidence, and instead indicate that it’s likely to take longer than expected to achieve that confidence,” he said. “That said, we think policy is well positioned to handle the risks that we face.”
“More recent data shows solid growth and continued strength in the labor market, but also a lack of further progress so far this year on returning to our 2% inflation goal,”
Double uh oh. To me, it means rates will stay higher for longer. Especially since money velocity is not decreasing with the labor market remaining strong and retail sales still robust.
We spoke about the oil breakout above $80. Since oil is the lifeblood of the economy, a rise in oil will impact inflation. Oil has dropped and is retesting close to the $80 zone. I expect buyers to jump in here but a close below $80 would be bullish for markets as it would subdue inflation expectations.
Going forward, inflation data will continue to move markets as expectations shift.
Speaking about oil, some are saying the markets are moving due to geopolitical tensions in the Middle East. The Israelis have said that they will respond to Iranian attacks. How punishing these attacks will be, remains to be seen.
I would say the interest rate/inflation aspect remains the current market narrative, but of course any major geopolitical developments would surprise markets.
Now to the charts.
This is not investment advice, but I personally shorted the US S&P 500 with the daily close below 5100. This took out the current higher low. But take a look at that trendline break. Yikes.
Now we have not pulled back to retest the 5100 level, but this is still possible before we continue lower. A close above 5100 would nullify downwards pressure. Watch for support around 4950, but the major support level comes in at 4800.
The Nasdaq is also looking bearish with a trendline break and a higher low break. Support comes in around 17000.
The Dow Jones is actually testing a key support level right now… and has been for three trading days. If the Dow breaks down lower, then this would also confirm more lows for the Nasdaq and the S&P 500.
For those that trade other markets, take a look at the Japanese Nikkei:
That’s a nice double top pattern with the breakdown triggered yesterday. Today saw the price retest the breakdown zone and so far, sellers are stepping in.
It should be said that these moves in markets are likely to be just corrections in the uptrend. The markets were overdue for a pullback.
BUT if interest rate expectations is the key narrative, then any shift in expectations would result in a larger market sell off. We will be watching these two charts:
Longer term bond yields are rising and have broken out. I would say they are in a new uptrend with higher lows and higher highs. If yields continue to ‘surprise’ to the upside, then markets could be in for a move much lower.
Remember: yields rising means bonds are being sold off. If you follow asset allocation and risk on/off principles, this is not indicating money running into stocks but running into the US Dollar for safety. Some would say gold too. Which would imply uncertainty and yes, some fear. Watch what happens in the bond markets and where that money is running into.