

What a month it has been for US stock markets. US markets have been in hard rally mode since June 1st 2023, with the Nasdaq seeing its rally begin on May 24th 2023. A few other markets in the world are joining in on the party. Japan’s Nikkei continues to break decades long records largely thanks to Warren Buffett and Berkshire Hathaway’s stake in the country. European equity markets have been a bit of a mixed bag, but the German Dax has printed new all time record highs. Unfortunately, the Canadian markets have not participated in such a rally. This is due to oil ranging, which influences Canada’s mainly resource heavy stock index.
But perhaps, the movements we are seeing have more to do with the actions and words of central banks? The Japan move makes sense since the Bank of Japan is not raising interest rates which is thus seeing the Japanese Yen get smashed. A weaker yen tends to help exporters as it increases the value of overseas profits in yen terms when companies repatriate them to Japan. Translation: A weaker Yen boosts Japanese exports and means Japanese companies make more money on their earnings. Something that analysts have pointed out as one of the causes of the Nikkei’s rip roaring rally.
Stock market gurus told their audiences at the beginning of the year that the major bullish market catalyst will be when the Fed pauses… or when the market perceives the Fed is near the end of its rate hiking cycle. As a trader, I have seen this play out with markets ranging until the next Fed meeting, or until rumors of what the Fed will do hits the airwaves. The recent run up in US markets largely had to do with the markets pricing in a Fed pause in June.
And the Fed delivered.
On Wednesday June 14th 2023, after more than a year of rate hikes, the Federal Reserve held rate hikes steady. However, Fed officials projected another two quarter percentage point moves are on the way before the end of 2023.
The Fed has taken the federal funds rate to 5-5.25%, the fastest pace of tightening since the early 1980s. Inflation is coming down, but is still above the 2% target threshold. Inflation data will still be watched, but it should be said that interest rates will remain high for a period of time. It is too premature to think of rate cuts this year when the Fed has two more hikes planned. But what about recession? Well, those job numbers are still coming in strong, and the Fed has pointed at this as a sign of a strong and robust economy.
What many of us will be watching is the middle/consumer class. Wage growth has not kept up with higher prices, and with borrowing rates reaching record highs, more households are going into debt and getting squeezed. Higher rates impact credit card rates, home loans, auto loans and even student loans (for those who take out new federal student loans). But taming inflation requires the slowing down of money velocity. Basically, central banks are aiming to slow down the economy. The Fed has used the term a soft landing. That they will be able to raise interest rates high enough to tame inflation and avoid a recession. But with Fed members expecting more rate hikes this year, that soft landing narrative will truly be tested.
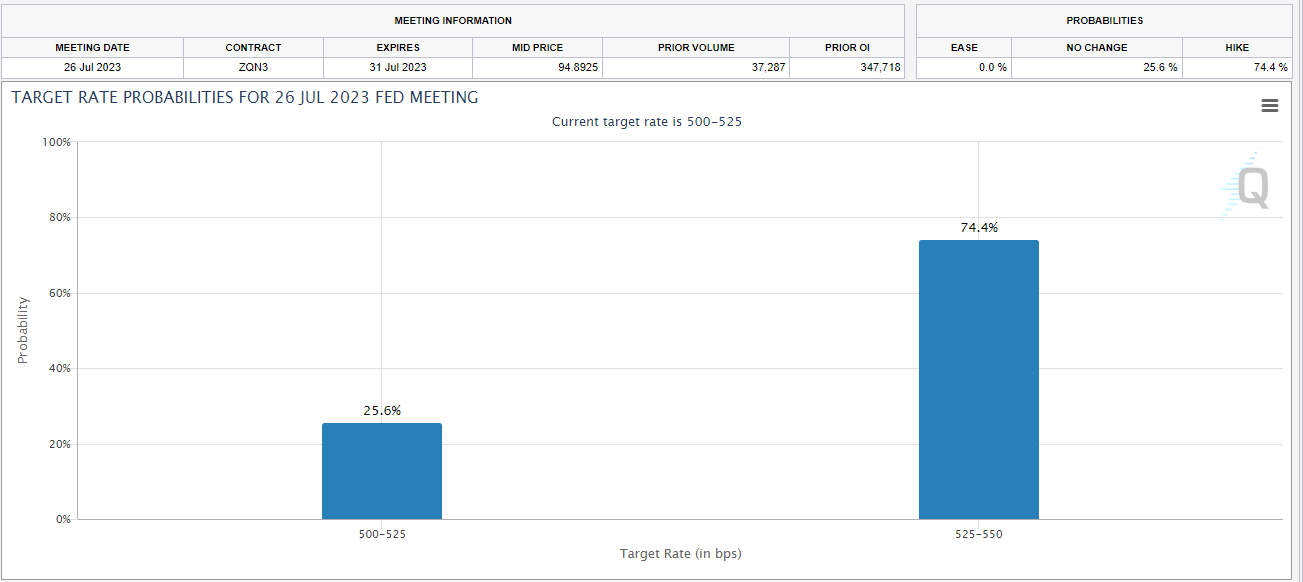
The next Fed meeting is 40 days from today in July. Currently, fed fund futures indicate that the market is giving a near 75% possibility of the Fed raising rates by 25 basis points in July. Remember, fed fund futures probabilities change on a daily basis, and we will get more out of this as we approach the next Fed meeting. But what this tells us is that the markets are already pricing in another rate hike, and won’t be surprised by Powell when he does raise rates in July.


As you can see from the daily charts above of the S&P 500, the Nasdaq and the Dow Jones, US markets have been in a strong rally. Especially the S&P and the Nasdaq. Both markets have rocketed after breaking out above their resistance zones (highlighted in blue), pulling back for the retest, and then heading higher.
The markets are euphoric because they are pricing in the end of the Fed rate hike cycle.
Before we get into the major weekly charts that I want to show you, let’s talk about other central banks and markets.
The Bank of Canada surprised markets with a 25 basis point hike after saying they would pause. A very similar surprise we got from the Reserve Bank of Australia a few months back. These central banks prove that central banks have not really paused, and rates have room to move higher.
The Canadian stock market remains in a range, while we are seeing some action in the Australian stock market, but this could be due to the central bank actions of their largest trading partner…
China CUT interest rates this week for the THIRD time. There is a big debate about the current state of the Chinese economy and if this means a global slowdown. Many contrarians believe that the CCP is more focused on shifting the economy from an export focused economy to a domestic consumption one. This has a lot of ramifications for recent geopolitics but I will discuss this in another Market Moment article.

As a currency trader, the current state of central bank monetary policies intrigues me. Money tends to run to the currency with the higher interest rate, or the currency that is expected to have higher interest rates (pricing in future rate hikes). Even though the dollar has gotten smashed due to the Fed “pause”, the dollar is gaining against the Chinese Yuan. Now yes, you can say this currency pair is not free floating, but it still poses a problem for the PBoC when the US is raising interest rates and China is cutting. Definitely something to keep an eye on in the future as the East begins to influence Western investment. You are already seeing a real life example with the move in Japan.
Back to currency rates. With the Fed pausing, China cutting rates, and other central banks still raising, it sets up a very interesting time for currency traders. Likely a weakening of the Dollar and the rise of other currencies with a hawkish central bank. The divergence I am watching is from Europe. Yes, Europe. With inflation still high in some European countries, the ECB has raised rates to the highest in 22 years. And they are likely to raise even more given the recent headline inflation data came in at 6.1% and rates are at 3.5%. This sets up an interesting setup for the most traded forex pair, the EURUSD, given that the ECB is likely keeping the foot on the accelerator pedal and the Fed is pausing.
Just important things I think my readers need to know. Currency markets and rate expectations can have a huge impact on equity markets.
With interest rate divergences in mind, and a possible impending recession with interest rates remaining higher for longer, let us take a look at the important weekly set ups of the US stock markets. I can tell you that many technical traders are watching these upcoming zones VERY CLOSELY.

The major weekly zone on the S&P 500 is the 4500 zone. If you look to the left, you can see this area is a major flip zone, an area that has been both support and resistance with multiple touches. Traders who are long likely will have some profit taking orders at or near the 4500 zone. This will be evident from a red or large wick candle when we test this zone.
Two things can happen here: 1) we either break above and confirm a weekly close above this zone, which sets us up for a slingshot move into new all time record highs for the S&P 500. Or 2) we reject and see the bears come back in driving the price lower. The big bear breakdown would occur later with a close below 4200.

The Nasdaq has the same technical setup. We are almost near the 15,600 zone and are already seeing some signs of bears entering. The resistance zone could lead to a sell off with the major bear breakdown level coming in with a close below 13,600.
But the market which interests me:

The Dow Jones. This market has been a bit choppy in comparison to the S&P 500 and the Nasdaq. And it could be because we are already testing, and have tested, the major flip zone resistance. The 34,500 zone has been acting as resistance since November 2022. Even with subsequent tests in 2023, the Dow Jones has not been able to breakout above this resistance level. Perhaps a telling sign of how important these weekly resistance levels will be for the other two major US markets.
Now if the Dow Jones can squeeze out a weekly close and breakout above this zone, this would be a bullish sign and would lead to the S&P 500 and the Nasdaq likely doing the same. But so far, this zone is acting as resistance as evident by the wick developing on this week’s candle indicating sellers are stepping in.
So are markets acting on the Fed? Or are they about to price in a slowdown and recession? From a technical analysis standpoint, next week will be a crucial week for US stock markets as we test these major resistance zones!