Energy commodities have been making incredible moves. All the talk is about natural gas. Oil prices are also looking very promising…and appear to be triggering a near term reversal pattern which won’t be great for the peak inflation crowd. While the big money looks at oil and gas, uranium is what is hot with the retail crowd. I am one of them. And it looks like uranium is ready for a rip higher.
The catalysts? For fundamentals, uranium bull Fabi Lara says that she has never seen the fundamentals this good for the yellowcake in her multi-decade career! Supply and demand imbalances have never looked this good, and uranium prices still are trading below their production cost of new marginal supply!
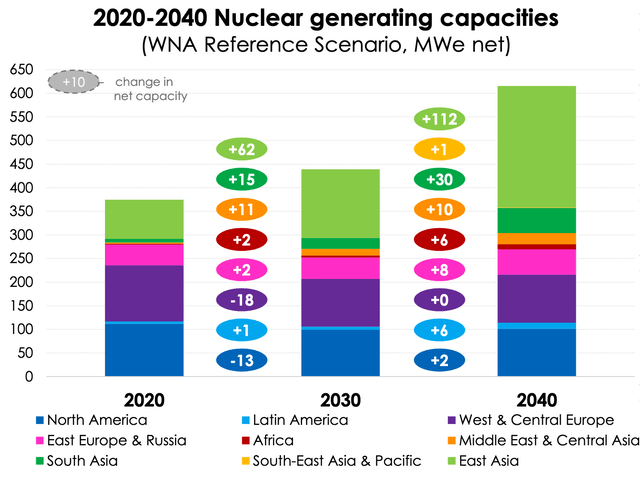
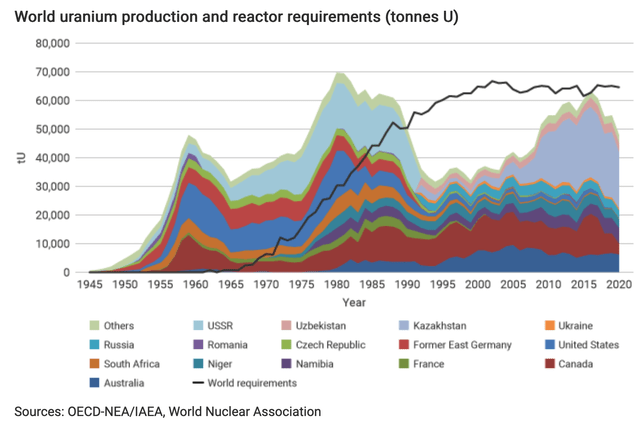
Many readers know the uranium bull thesis. The world needs to shift to CO2 free clean energy and uranium fits the bill as nuclear energy can handle baseload power. (Boy those Europeans are probably going to be regretting deactivating those nuclear power plants when they deal with energy shortages in the upcoming colder months!). The world needs and will demand more uranium, but in order to incentivize new primary supply, uranium prices will need to go a lot higher.
All the fundamentals are great, but what gets me pumped up as a trader and investor are the technicals. The charts are indicating that NOW is the time to allocate your cash into uranium stocks.
Over two months ago, I wrote a technical piece indicating that the current uranium pullback was a great opportunity to buy the dip. Let me share with you the uranium chart from that article:
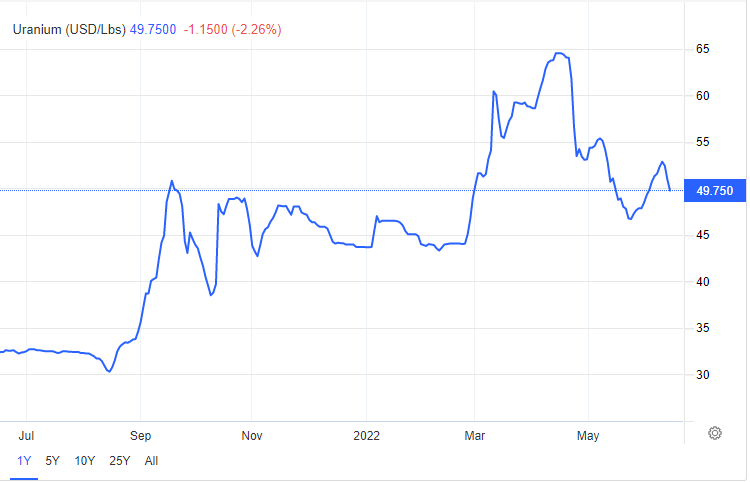
I highlighted that $45-50 is a major support zone. This is an area where I would expect prices to bounce from here.
What gets me excited is the current uranium chart set up:
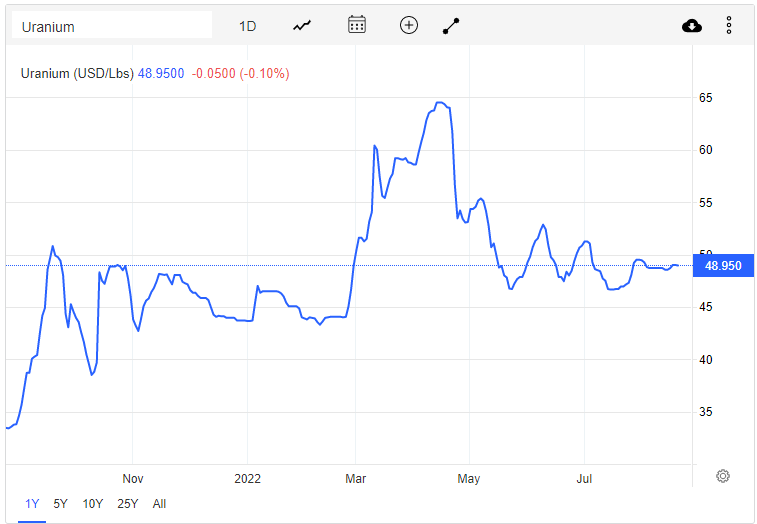
Now that’s what I am talking about!
Uranium price remains above $45, and has not broken below for two months. To me, this is a sign that selling pressure is exhausting and there are buyers holding the line.
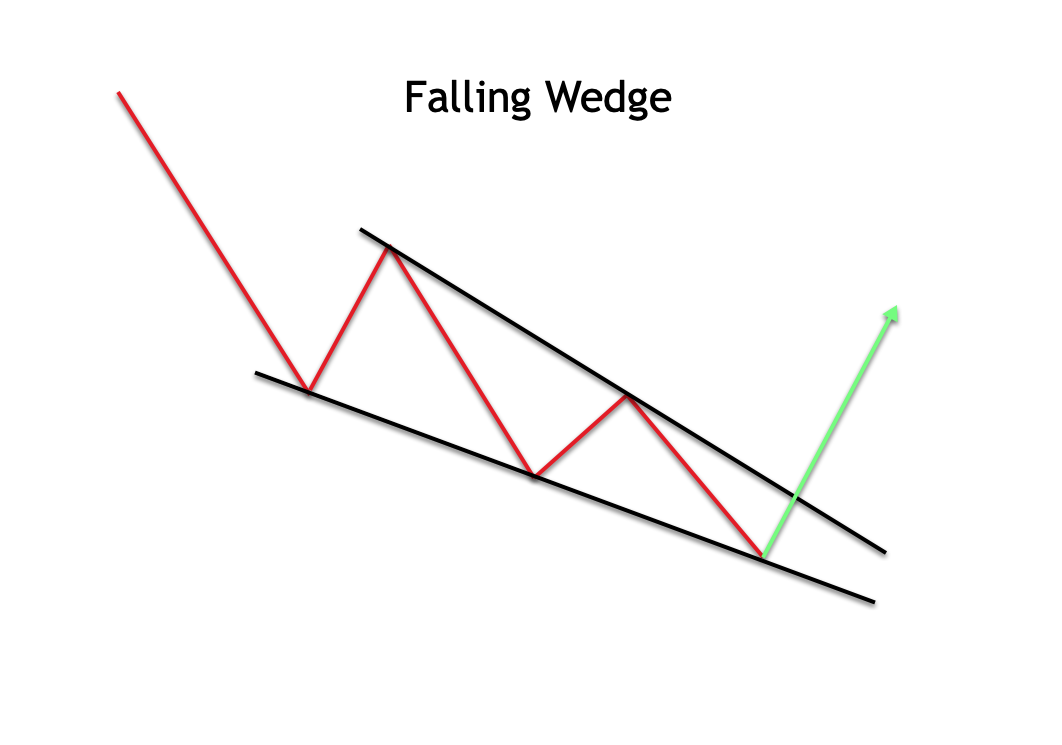
Uranium has been ranging since late May 2022, and a break will be the trigger. I see a falling wedge chart pattern in development.
If you have read my other uranium technical posts, you know I don’t stop with the uranium chart. Let’s take a look at other charts which will help us determine where uranium is going.

Sprott’s physical uranium trust is my preferred way to keep track of the uranium spot price action. Both charts look similar, and U.UN is holding above $12.40 which is the equivalent to the $45 zone.
Note that in late July 2022, U.UN broke and closed above my downtrend line with really bullish price action the following day. That was a very nice sign but unfortunately, there was no follow through. From a technical perspective, U.UN looked great as long as it held above $14.40. This did not happen.
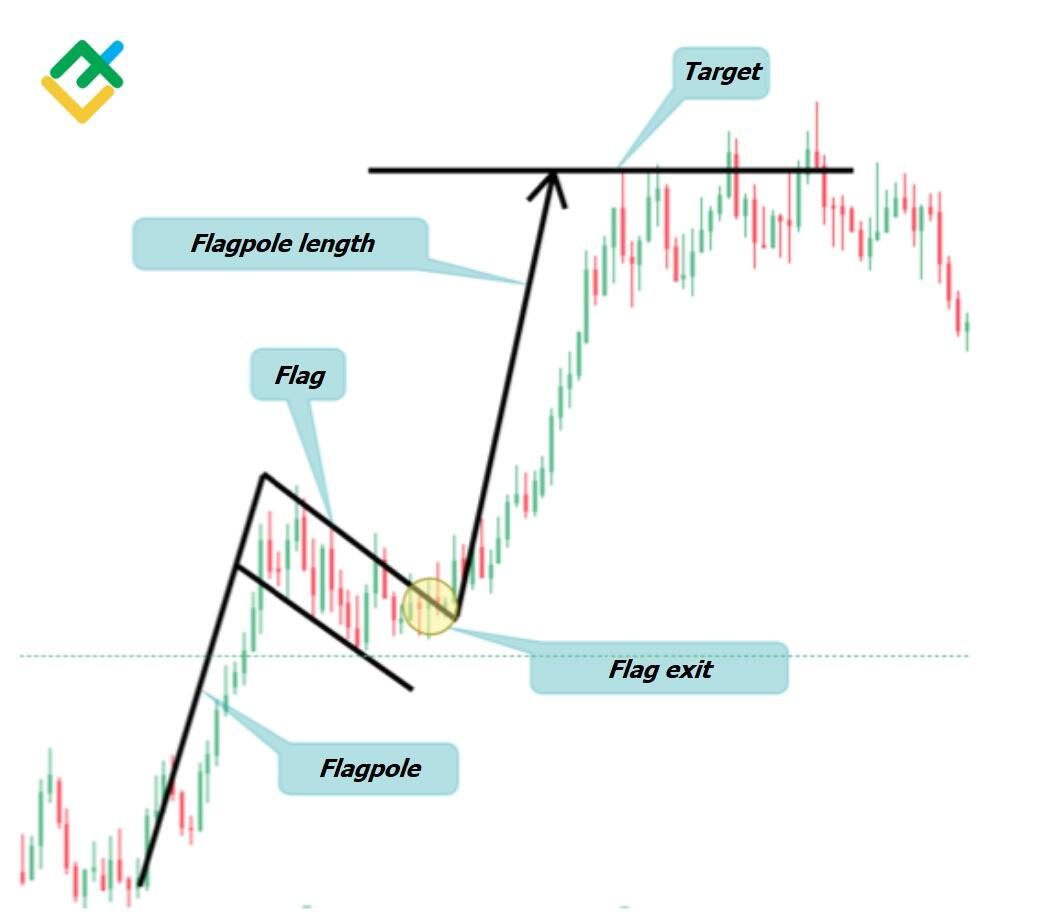
Instead U.UN is now slowly trending downwards albeit in a channel with multiple days of green followed by red. We are now looking at another trendline breakout, but this time in the form of a flag pattern. Literally think of it as a flag pole with a flag hanging on it:
Everything technically is pointing at higher uranium prices. But the breakout is required! The flag could continue to range for a few more days or weeks before confirming a break. Alternatively, if we close below $12.40, then it would be a sign that my technical analysis was wrong.
Let’s finally take a look at a big boy uranium producer. Cameco Corporation.

Hmmm it doesn’t bode well with my technical trained eyes. I am not a fan of this setup currently. The stock has been ranging between $32-$34 for 3 weeks before selling off hard on August 19th 2022. The stock has climbed up for a few days since that sell off. But I wouldn’t say we are in the safe zone yet. It appears as if the price is retracing to retest the broken down trendline and resistance at just below $32. I would expect sellers to pile in and continue taking the price down to $27. The bullish case? We get a close back above $32 which would nullify the current breakdown.
Was there a major catalyst which caused the drop? Nope. Which is why many are seeing this as an opportunity to buy the dip including Advisor Group Holdings.
In summary, the uranium spot price remains in its basing stage and is looking for a breakout trigger. The fundamentals are spectacular, and all that we await is the technical breakout.