The oil price breached above $90 recently. We are trading at levels not seen since 2014. A lot of investors and traders have been focusing on tech and cryptos, but it would be prudent to keep an eye on energy and commodities as a whole.
As oil prices rise, it will add more inflationary pressure. Fuel/energy is included in CPI data, and when fuel costs rise, so do transportation costs. This can impact food prices and the prices of pretty much everything else. With increased transport costs, prices will have to rise as businesses pass on that extra cost to consumers.
Russia-Ukraine tensions add more pressure on oil and gas, but there are other factors. OPEC plus seems to want higher prices, and Russia and Iran don’t really have an incentive to help the US. OPEC plus government coffers just increase with higher prices. There are headlines that an Iran nuclear deal may be agreed upon in the upcoming days. This could be a news event which oil may react to at first.
My readers however know that my take on oil has been the inflation trade. I wouldn’t say oil is rising due to a stronger economy. China cut interest rates about three weeks ago to try and boost their weak economy. When China slows down, we tend to see a major impact on oil and other commodities. We haven’t really seen that. My take is that commodities are where you want to be for the inflation trade.
We very well can be in a situation where interest rates are rising by 25 basis points, yet inflation keeps on increasing. There will be a time when the markets may begin to question the Fed’s ‘transitory inflation’ narrative. When that occurs, I believe money will run into precious metals and other commodities such as oil.
There are already talks of $100 oil, and some major banks are predicting around $120 by the end of 2022. Again, just adding to inflationary pressures. Do I think $100 oil is coming? Yes, but I want to see a pullback first. Actually, the pullback that we are seeing right now is what I wanted to see. This means that the $100 price target may be reached by Q2 2022 (although some major bulls predict by Q1 2022!)

Above is the weekly chart of oil, and I think it should be analyzed on this longer timeframe. A few weeks ago, Oil broke above $84, and I wrote about $90-$100 oil next. Well, we did breach above $90 for sometime. Currently, oil prices are pulling back. Great. This is what we bulls want to see.
Notice where the pullback is occurring. At a major weekly resistance zone. I am watching for a deeper pullback. I want to see oil tag the $84 zone again. From here, I would like to see the ascension and run up to $100. For my technical geeks, a weekly higher low taking us above recent highs of $92.80 and then setting up the move to $100. My major resistance actually comes in at $110, meaning we could very well just slice through $100 like a hot knife through butter. But $100 is a major psychological important zone, and when we hit three digit oil, the media and everyone else will be paying attention. Expect volatility there.

Taking us down to the daily chart, I have drawn out what I want to see at major technical levels. Just a pullback and a higher low. It really does seem with this daily chart close, we are printing an evening star pattern.

I quickly want to highlight Chevron (CVX) which printed new all time record highs. This is my favorite large cap oil company because their balance sheet looks much better than the others. And Chevron is beginning to diversify and look into geothermal and other renewable energy sources. Exxon Mobil and the ticker XLE are also charts to watch with breakouts, but not making all time record highs like Chevron.
How about the charts of some Canadian energy companies?

Crew Energy (CR.TO) continues its uptrend. In fact, all the charts we are going to look at are. There is a channel here that I am watching which is about to be tested. However, if I am correct on my oil pullback trade, then I expect Crew Energy to break below this channel. I would then be looking at major support around the $2.80 zone.

No surprise with Cardinal Energy (CJ.TO). Similar market structure, and the upwards channel here looks like it could be tested as early as today. The big support I am watching is $4.50.

Ensign Energy Services (ESI.TO) looks different as the company deals with oilfield services. Drilling and infrastructure. You can clearly see the stock has been rejecting this resistance at $2.30 for multiple weeks. We have attempted to breakout many times but to no avail. Selling pressure continues. With the oil drop, I expect the stock to pullback. I would be watching the $1.80 zone. If the stock breaks out though, this is one that would be a nice breakout play.

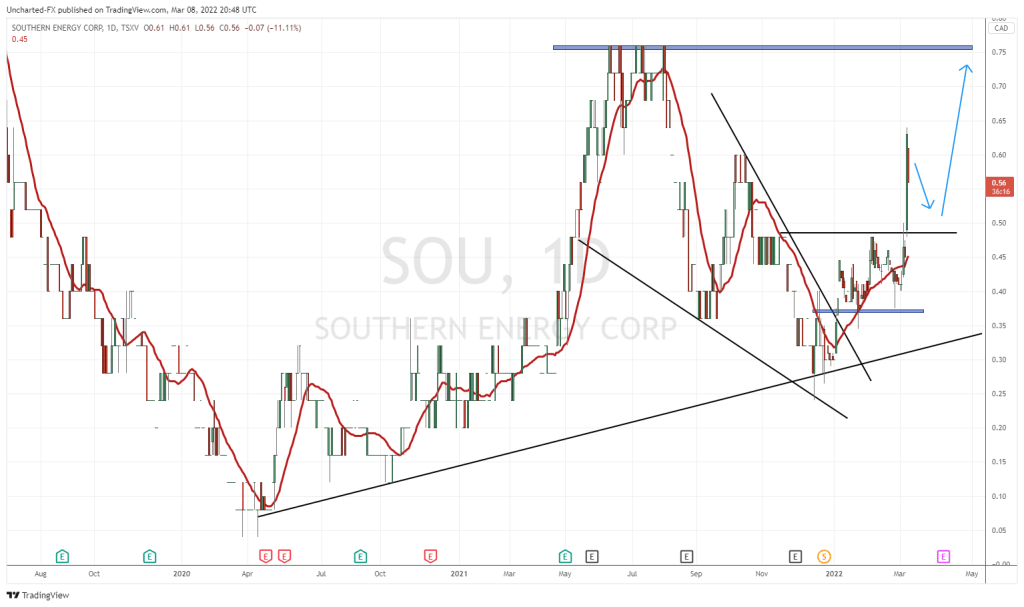
Southern Energy (SOU.V) is one I covered recently, and was outlining the wedge pattern. Well, we broke out of it. We did see buyers step in close to the retest. The volume on this one is not as high as the other mentioned stocks, but we do have interim support here at $0.44. Volume is a reason why this stock hasn’t taken off like other oil plays. If the stock drops on oil weakness, then $0.375 is the major zone to watch for.
In summary, I remain bullish on oil and energy in the long term for the inflation trade. However, I would be looking for an oil pullback. This sets up an entry opportunity for a run up to $100 and beyond, and oil stocks will follow. Personally, I am waiting for a nice point for re-entry.