Today is a BIG day for US Stock Markets. A major support level is being tested, and depending on the close today, a trend reversal could be in the cards.
First off, stock markets were shaky yesterday after August inflation data. CPI for the month of August came in less than expected at 5.3%:
The consumer price index, which measures a basket of common products as well as various energy goods, increased 5.3% from a year earlier and 0.3% from July. A month ago, prices rose 0.5% from June.
Economists surveyed by Dow Jones had been expecting a 5.4% annual rise and 0.4% on the month.
Media headlines are somewhat misleading. Sure the number missed expectations. Came in lower so it supports the Fed ‘transitory’ narrative. But let’s be honest folks. 5.3% is still quite high. Today, Canadian inflation hit highest levels since 2003 hitting 4.1%.
Stocks sold off on this news…likely due to the fear of a taper tantrum. The markets want cheap money. It really is what is keeping them propped.
Pandemic fears adding fear to markets? Perhaps. But I would look to China. Property developer Evergrande has been in the news for weeks. Now we are hearing they may fold (well not really, the CCP will step in of course), and if so, it would impact Chinese real estate and potentially, world real estate.

This is an important topic because many analysts and pundits believe China is due for its 2008 like credit crunch. It will happen some day. Maybe it is now? Which may explain why the CCP has been clapping down harder on tech companies and society in general with their video game and sissy men laws. Evergrande could be the black swan.

Now to the charts.

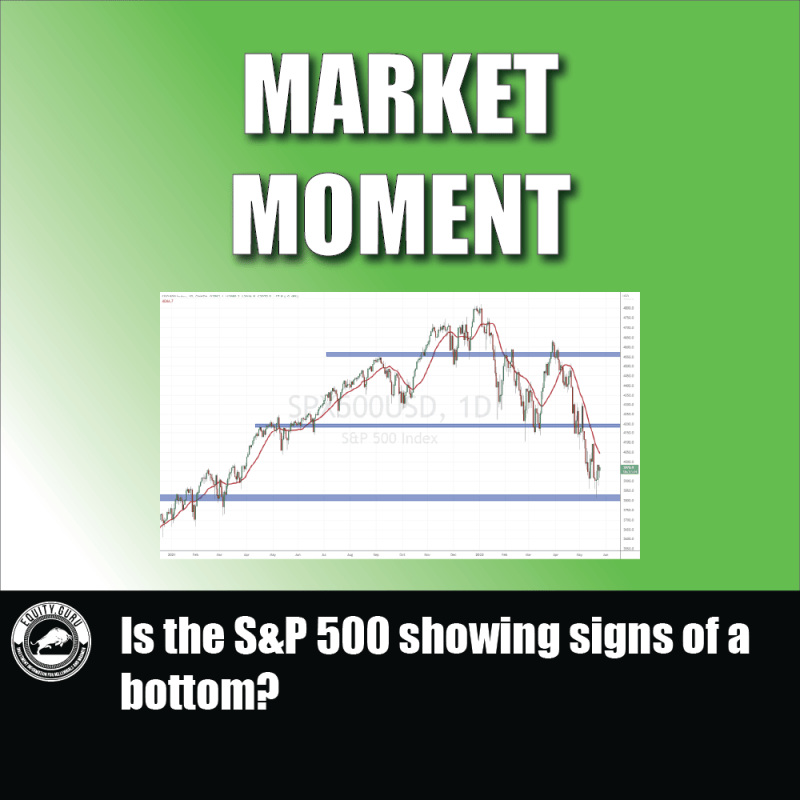
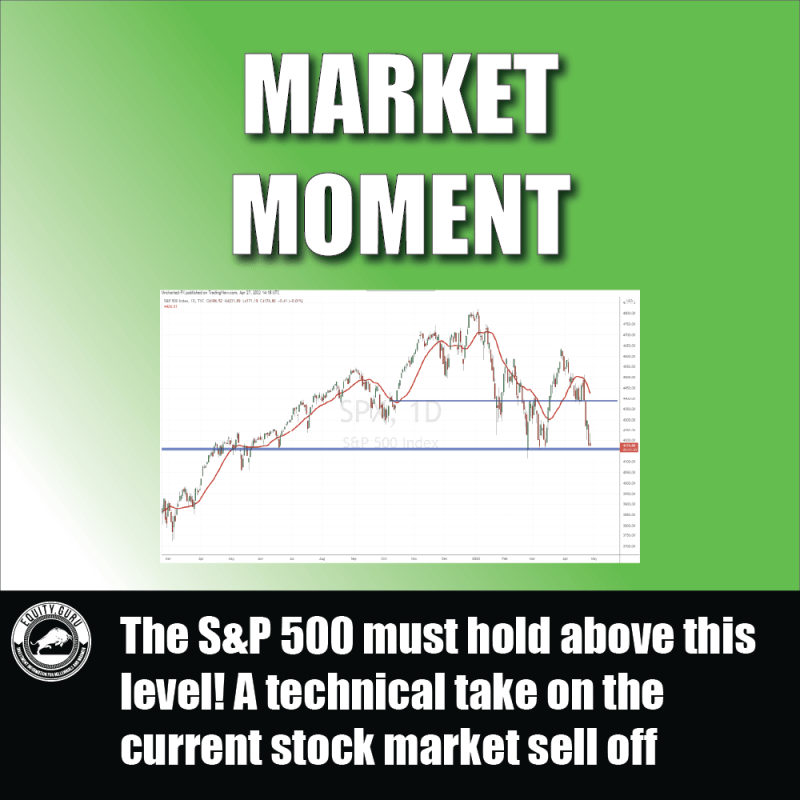
My focus is on the S&P 500. As you can see, the market drop has taken us to test a major support level. We have touched a trendline going back to May of this year.
Trendlines can be subjective. People draw them differently. But the main rule I go by is that if we have THREE touches, the trendline is a valid support level. In this case, we are testing this trendline for the sixth time now.
If we are to continue this bullish trend, we would expect to see buyers step in here. Want I would like to see in order to feel comfortable that markets continue higher and make new record highs would be a close above the 4490 zone as we would take out a lower high on the 4 hour chart, but also take out the previous red daily candle. This could mean an engulfing candle printed on this retest of the trendline.
Let me show you the 4 hour chart, so you can see that the S&P 500 is literally hanging on for its life:

24 hours worth of ranging at the trendline. Wow. A battle going on between the bears and the bulls. This is what I will be watching intraday today.
So in summary, the uptrend is still intact. But a close below this trendline either today or sometime this week, would mean a shift in trends.
Are there other charts we can look at to gauge what markets are likely to do? Of course. My readers know we like to look at Bonds, the US Dollar, and the Japanese Yen. I will save Oil for tomorrow’s Market Moment.

Above is the daily chart of the TLT. This is my preferred chart for bond market action. At the beginning of this year, I highlighted how this chart is one of the most important. It looks like bonds will be rising which means interest rates will be dropping. We had a reversal confirmed with our double bottom breakout above $140, and now the momentum is continuing.
Yesterday, as markets dropped, TLT spiked. The spike even broke above a triangle pattern I have drawn out. When money runs into the safety of bonds, it is a risk off environment. Fear. Watch how TLT plays out today. So far it is red, which is coinciding with stock markets holding flat. If TLT picks up and we continue higher to $152.50 and even breakout. Well then things do not bode well for the Stock Market.

I like to see the US Dollar AND Bonds rise together for concrete evidence that there is some fear. The Dollar had a remarkable turn around day yesterday going from red to green. It added to some stock market pressure. But today we are red, and the Dollar mainly remains ranged between 92.30 and 92.90. Just waiting for the break on the intraday charts.
Once again, if the Dollar rises alongside bonds…stock markets better watch out!

Finally, what some consider the true safe haven, the Japanese Yen. Although one of the reasons for the Yen’s safe haven status is under question. Japan has always been seen as a politically stable country. But now Japan has had two Prime Ministers resign in two years.
Looking at the Japanese Yen futures chart, things are leaning towards the bullish side. We been in a downtrend, and now a range. Just watching for that breakout.
As a Forex trader, the Yen pairs have a correlation with stock markets. The Yen weakens when markets move up, and the Yen strengthens when when markets move down. A breakout here on the Yen futures wouldn’t bode well for Stock Markets.
Are stock markets going to crash? Or will the Fed and the plunge protection team step in to brrrrr it up? We shall wait and see. So far we have the technicals, which are telling us that this is a MAJOR inflection point for markets.