Stock Performance
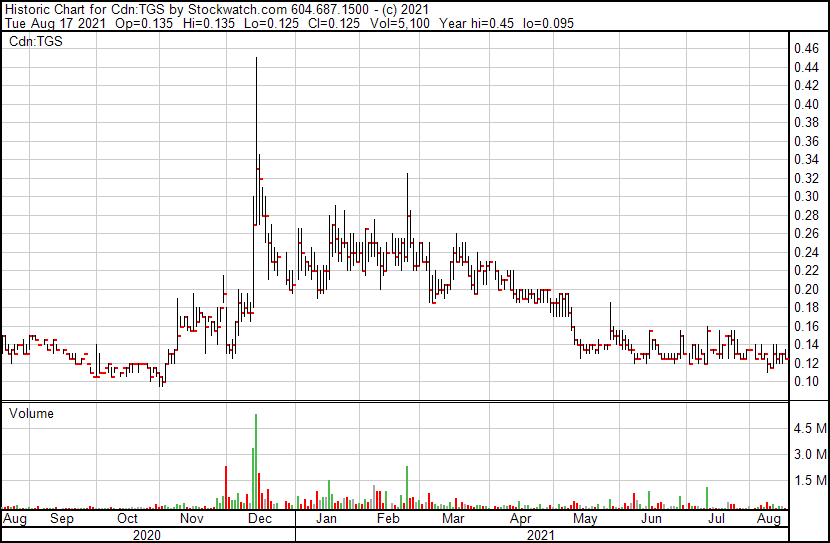
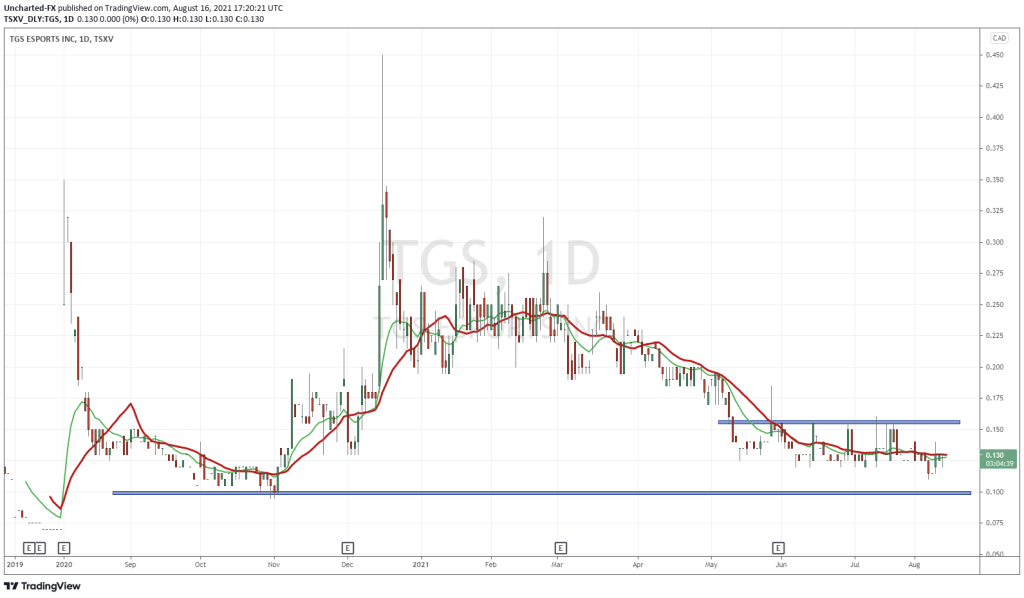
TGS Esports (TGS.C) ordinary common stock has had a rough ride over the last year. On Aug 18, 2020, the stock was trading at $0.13 and over a 77-day period ending November 2, 2020, the stock lost 22% of its value closing at $0.10.
Following the 22% drop was a chain of amazing news for the business in November that caused the stock to skyrocket from $0.10 per share to $0.33, a +220% price jump in 45 days.

From its peak of $0.33 per share, it lost 60% of its value from December 2020 until August 2021. As of this writing the stock is trading at $0.12 per share. This boom and bust must have been difficult on the ordinary common shareholders and them to avoid the stock completely as the volume traded on the exchange has decreased significantly over time.
What happened, and is the business performance the same?
The stock market has a tendency to overreact to information and this can usually be an opportunity for investors to profit from these short-term issues that a company can be facing. Of course, not all short-term issues are short term in nature and sometimes the underlying business is deteriorating, and the stock market might be correct in its valuation, but the only way to check this is by looking through the numbers and actually seeing if the business model, management team and the culture are working.
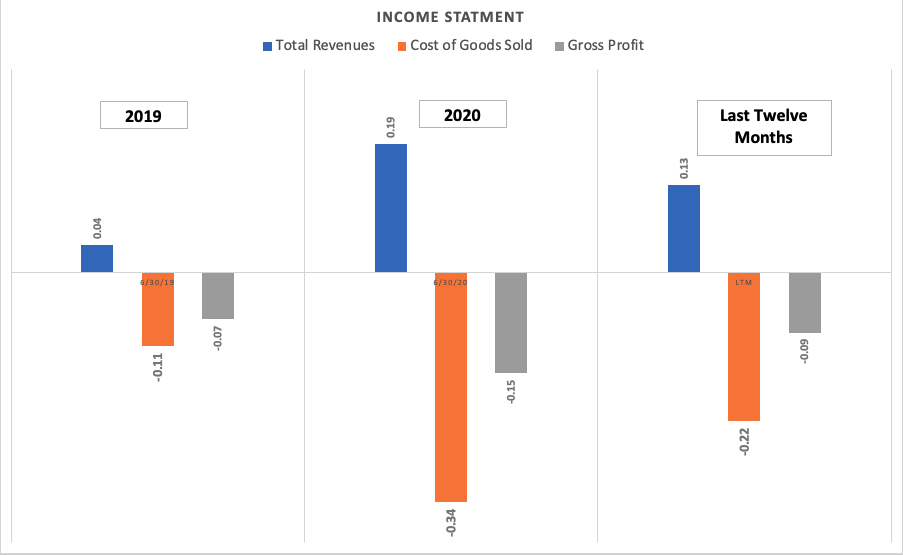
The chart above is a graphical representation of the income statement for the company since 2019 ending in the last 12 months of 2021. The blue bars are the total revenues, and we can see a general uptick in sales from 2019 to 2020, and then a gradual decrease over the last 12 months, we should keep this in mind, it has been a difficult period for most companies and revenues have experienced some sort of compression as people rebalanced their spending on discretionary purchases like tickets for entertainment.
But the important thing you can see from these numbers is that from 2019 to the last 12 month’s figures the cost of goods sold has decreased. This reduction in the cost of goods sold, which is the expenses used to produce the final good, has allowed the company to make significant operational improvements that allowed them to make fewer sales but generate a smaller loss in gross profit. As the company is still generating losses this might not be as evident from a quick glance of the income statement but when you graphically represent it like this you can see that there is some sort of corporate-level efficiencies being utilized by the operators.
So, unlike the stock, the underlying business has somewhat improved its corporate-level efficiencies and has received significant news of partnerships, deals, and contracts that allow it to improve its future top-line figures.
The issue here might be an initial overreaction by the market that caused the stock price to skyrocket in December of 2020 and then the sales figures did not jump appropriately to match the initial speculation causing people to become very pessimistic about the prospects of the company.
Of course, this is not a full-scale analysis, and a deeper dive into the working capital situation and some of the projects that they have lined up in the future would need to be evaluated to identify if the intrinsic value of the business is still intact. But I think the point is clear that the market has a tendency to overreact to information and as an investor, the best thing you can do is take a step back and reassess the material information that is public to you and assess if the business model is working or if its time to deploy your capital somewhere else.