Precious Metals are getting SLAMMED. If you are someone who follows, or invests in precious metals, you have probably seen this many times. Whenever Gold and Silver bulls get excited for the long term prices due to excess money printing and monetary policy, the metals tend to go the opposite way. Price action does not act as the metal bugs expected it to. I must say, when Gold and Silver tank like they do today, it is demoralizing. Disheartening. Whatever word(s) you want to use to describe an attack on your spirit, because that’s what it feels like. In this Market Moment, I hope to provide some comfort and solace to Gold and Silver investors. With a focus on Silver in today’s piece.
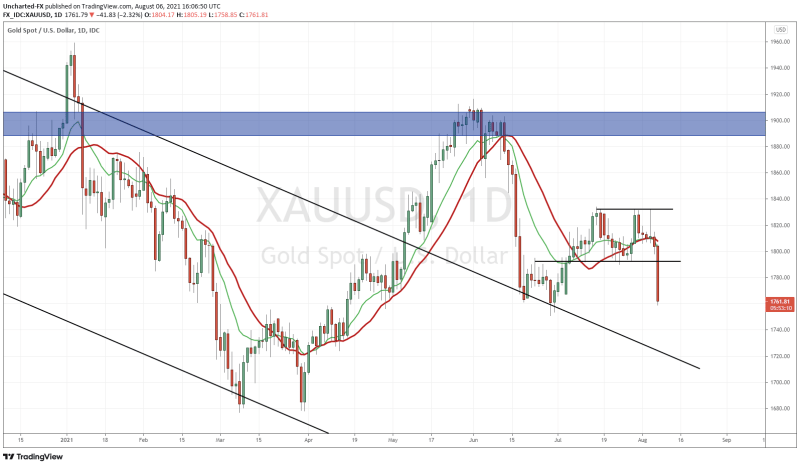
Before delving into the Silver chart, I bet many of you are asking WHY this happened? The big elephant in the room is the US Dollar. There is still that inverse correlation between the US Dollar and Precious Metals. When the US Dollar moves up, metals move lower. When the US Dollar moves down, metals move higher.
The US Dollar (DXY) is on a rip today. And it has to do with the Fed. A bit of a journey, but bear with me here.
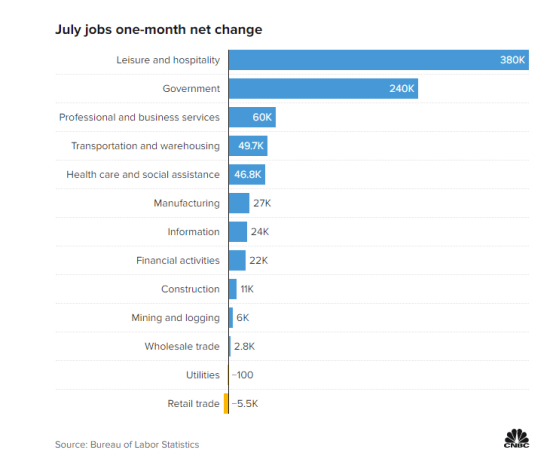
US employment numbers came out today, non-farm payrolls, or NFP for the month of July. The US added 943,000 jobs for the month, which BEAT expectations of 845,000. Not only that, but the unemployment rate slid to 5.4% compared to 5.7% expected. Good data all around.
Do you all remember the last two Fed meetings? Everyone is waiting to here when the Fed begins to taper. The Fed keeps pushing it down the road. But in the last Fed meeting, Jerome Powell said that the economic data is beginning to meet the Fed’s criteria. We aren’t there, but we’re getting there. Traders are pricing in the fact the Fed may taper soon. They are pricing in a change of diction from, “we are thinking about talking about tapering”, to “we are talking about tapering”. Today’s positive NFP data might be the clincher, and in a few weeks time, we might see a more hawkish Powell and Fed. This might be the month where we hear about real tapering. But some caution: the Delta variant could still derail all of this.
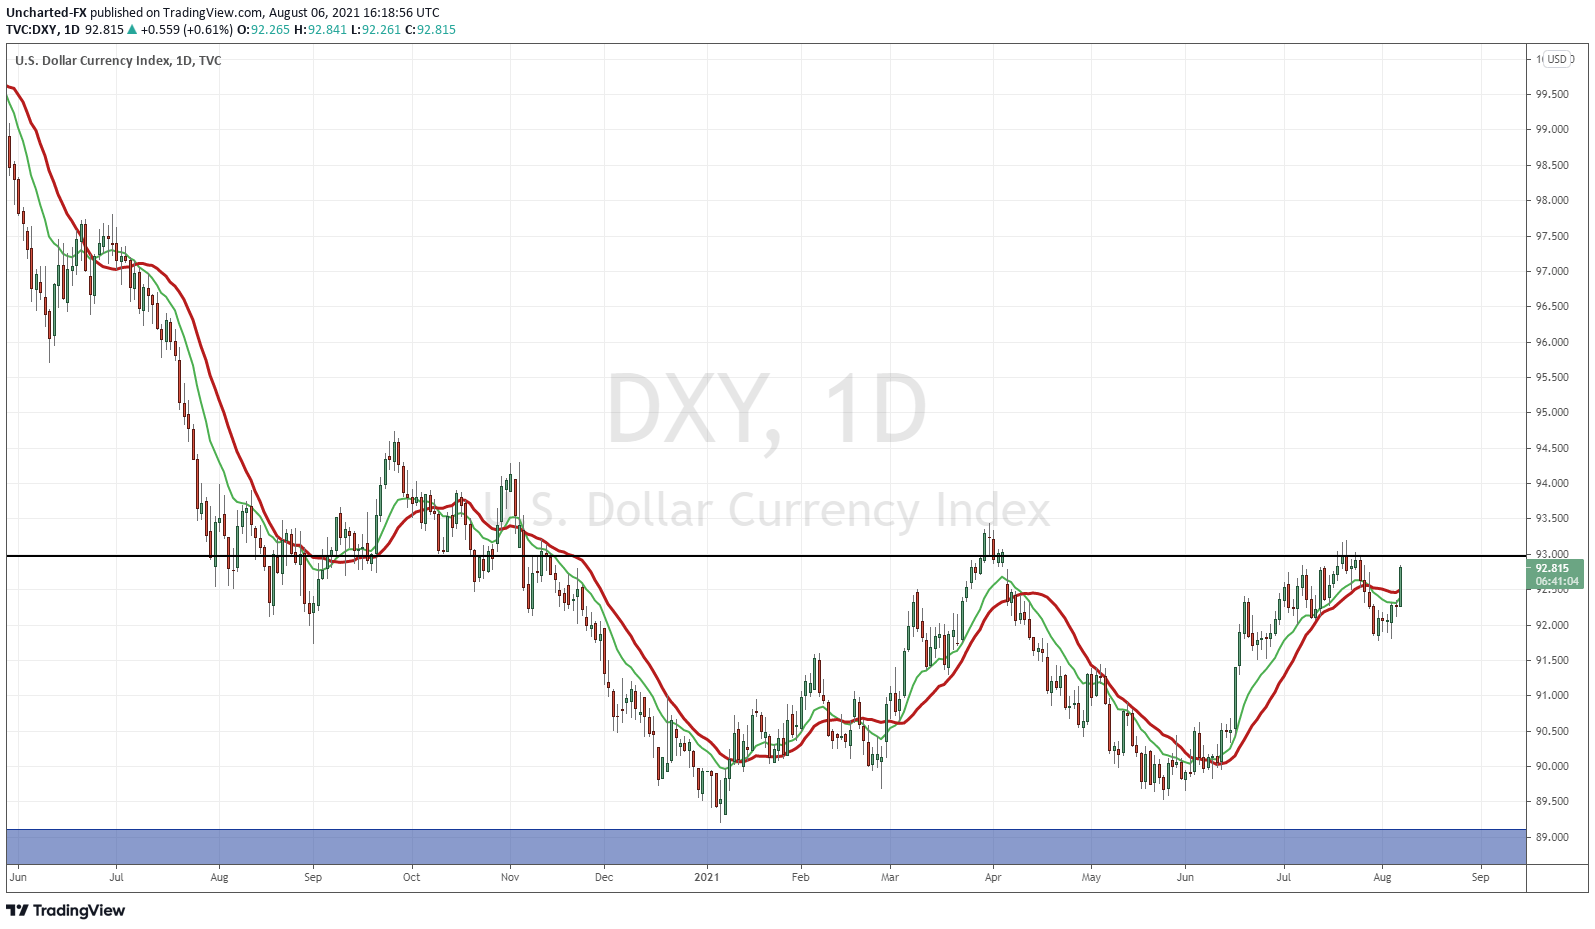
The Dollar popped today because of Fed expectations. If the Fed is going to taper soon, and thus potentially hike rates sooner than later, the Dollar is what you want to hold. Purely for interest rate differentials. You may hear me talk about the Dollar as soon as next week, because we are approaching a zone which may trigger a NEW Dollar Bull run.
Technical Tactics
So the Dollar is propped on tapering expectations. If it gets stronger, and remains strong, we will still see some downside on Silver.
For longtime Market Moment readers, I want to take you back in time. I want to take you back to my overall Silver analysis:
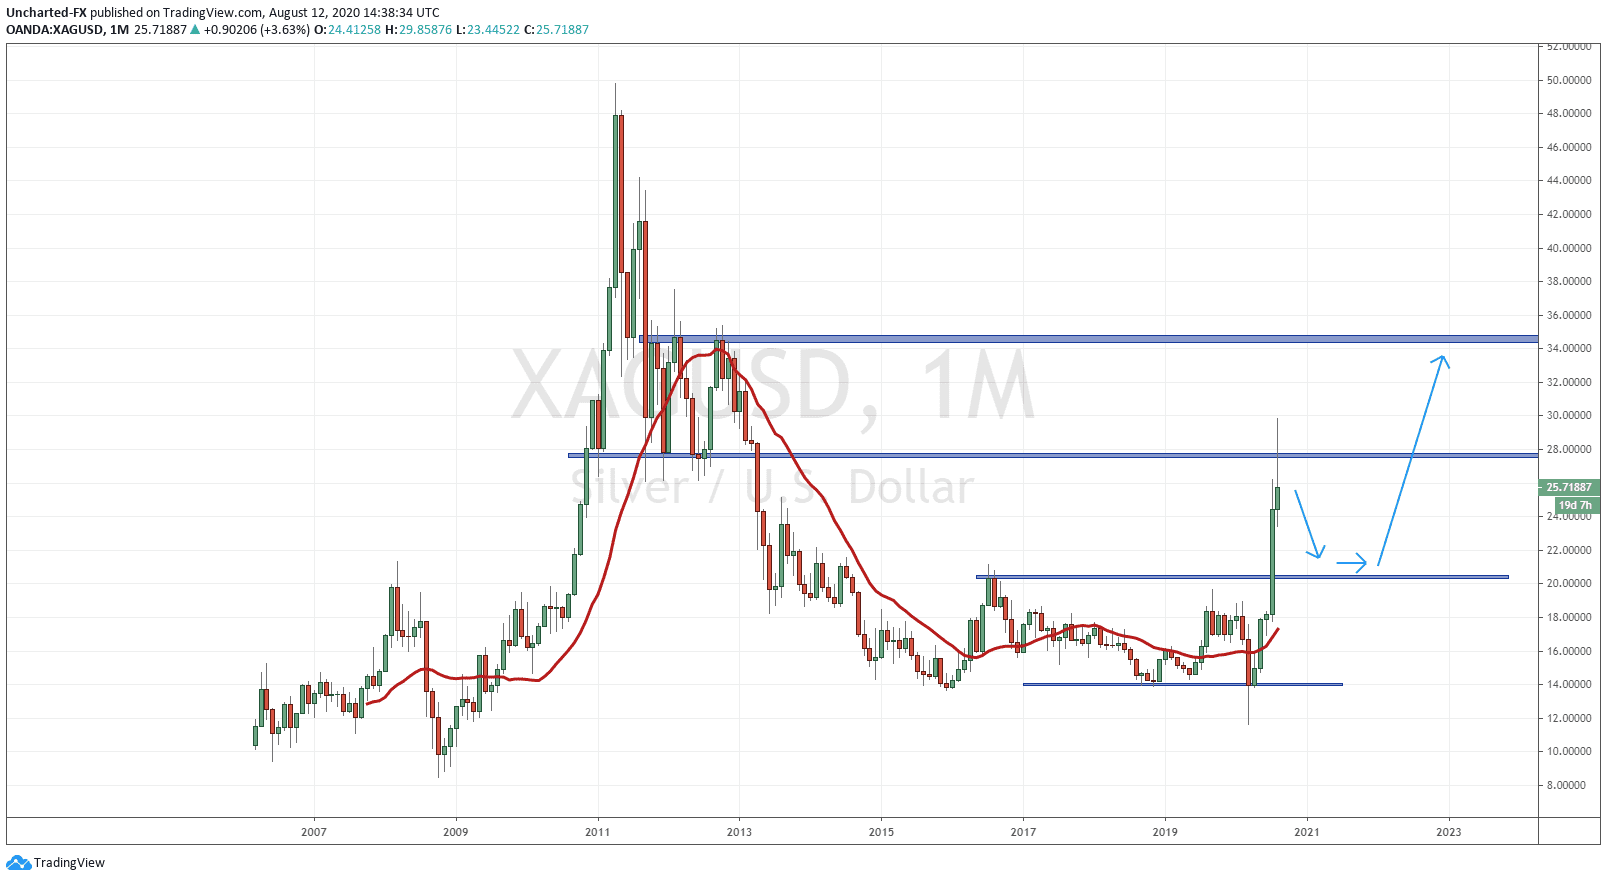
Above is the monthly chart of Silver almost a year ago! August 12th 2020. You can read the full piece here. This is why I love longer term analysis and market cycles. You can almost predict future events. We expected Silver to find some resistance at $26, before retesting the breakout zone around $20. Then, we would see buyers step in and we would shoot higher above $28.
In that article, I said that the retest of $20 may be the last time we will get to buy Silver at these prices for a long time.
This is how the monthly chart looks now:
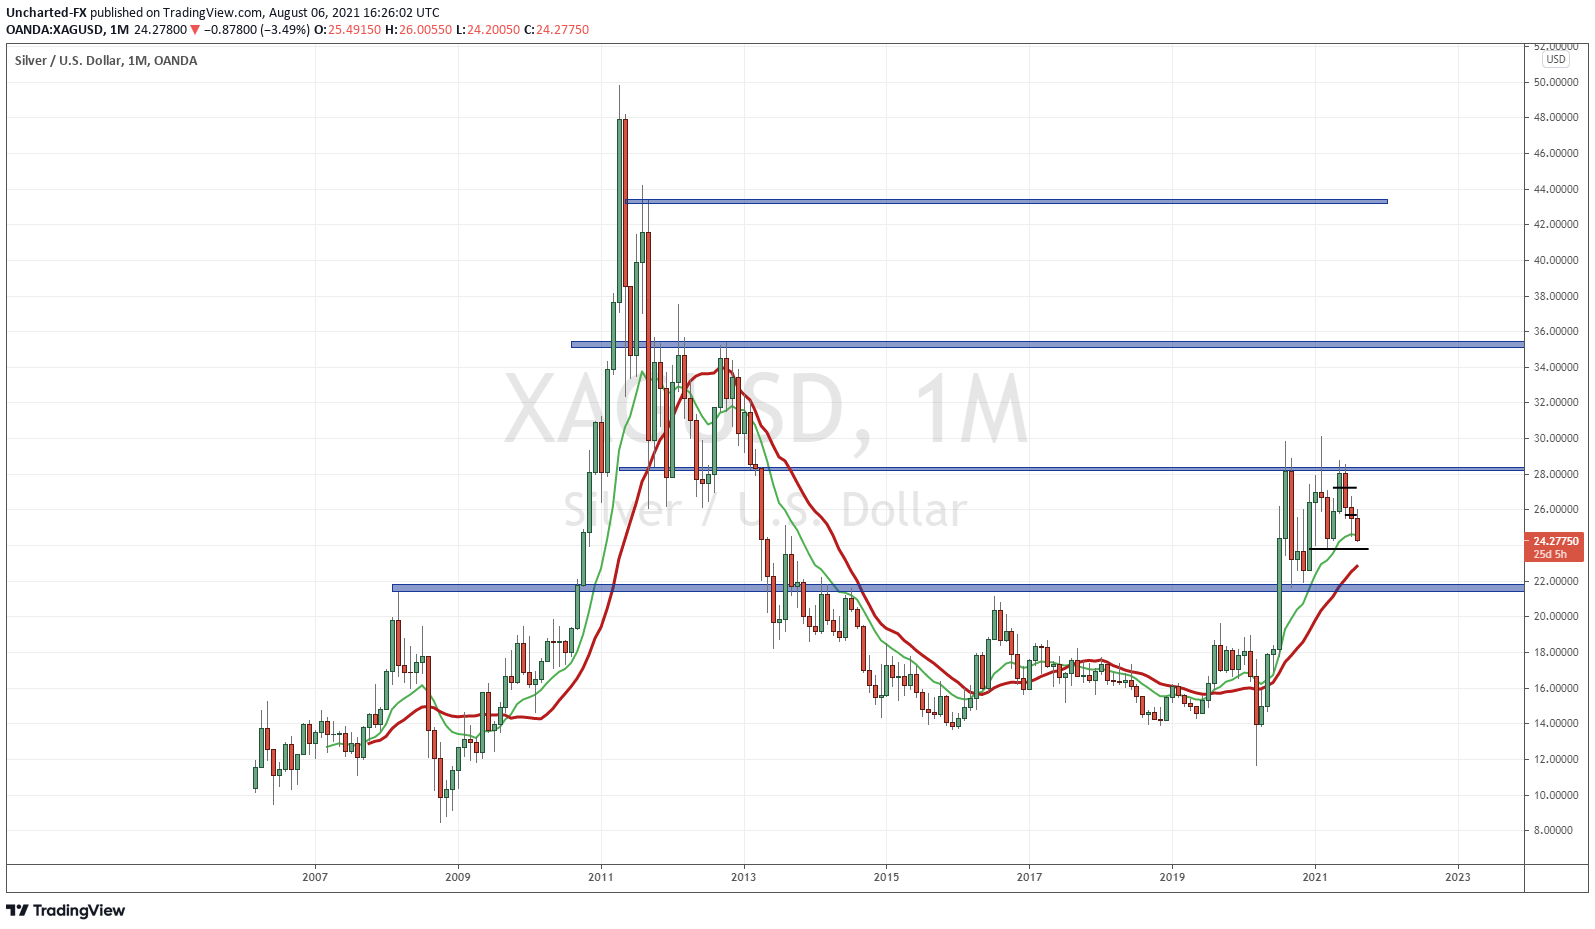
I adjusted the price levels just by a bit to accommodate the price levels, but the MAJOR levels remain the same. Silver just couldn’t get above and sustain momentum even with three tests. Unfortunately, this does mean we are likely heading lower…on a stronger US Dollar. $20-$22 remains key. We MUST find support here folks in the upcoming months. If Silver sees a close below $20, I would have to say that the metals run up ain’t happening. Maybe the deflationists were right.
I am still bullish on Silver due to inflationary pressures which may come from supply chain issues and new variants. Oh yea, and the excessive monetary printing which has seen people with more money now competing for the same number of goods and services since productivity has not gone up. Remember: metals also do well in a confidence crisis. It seems like people are slowly losing confidence in governments, central banks and the fiat currency. It’s not a pretty picture, but it will be bullish for Gold and Silver and other hard assets.
I will end this off with some near term positivity:
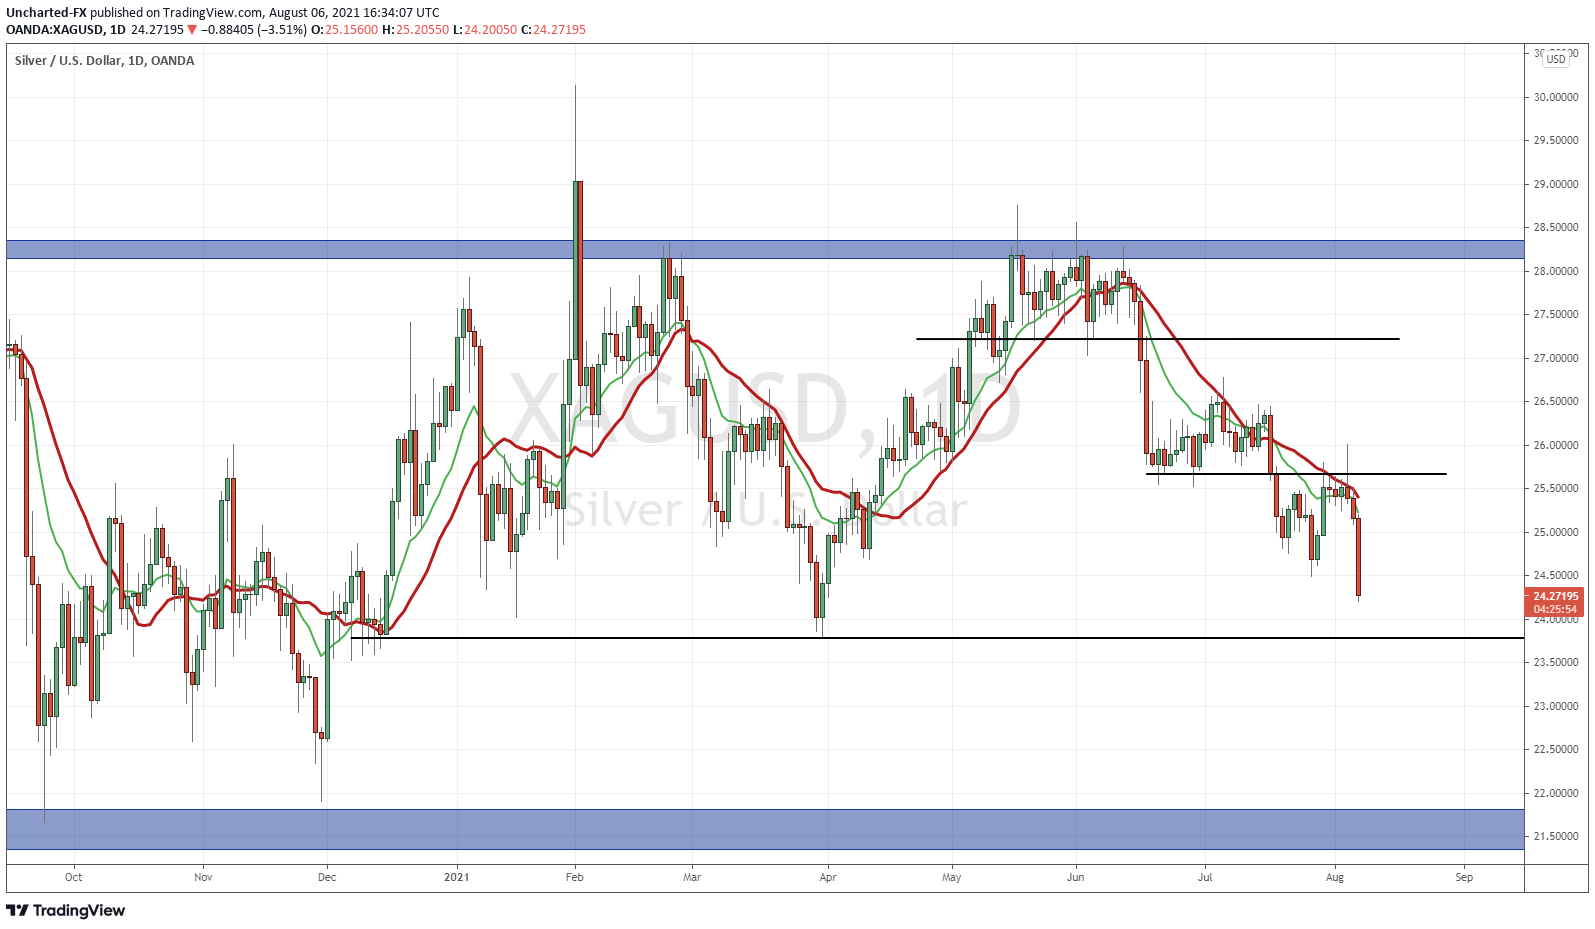
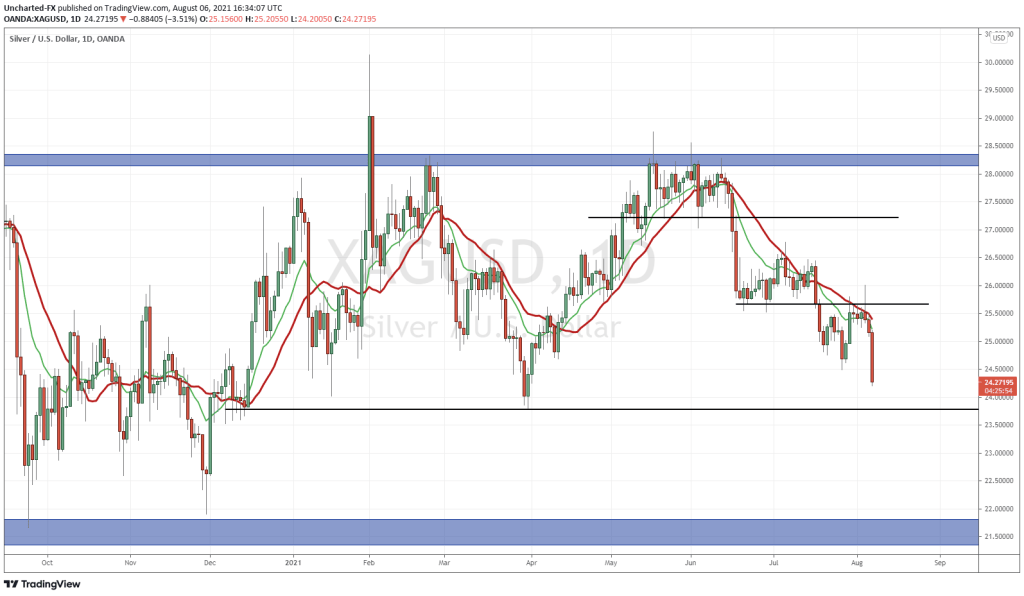
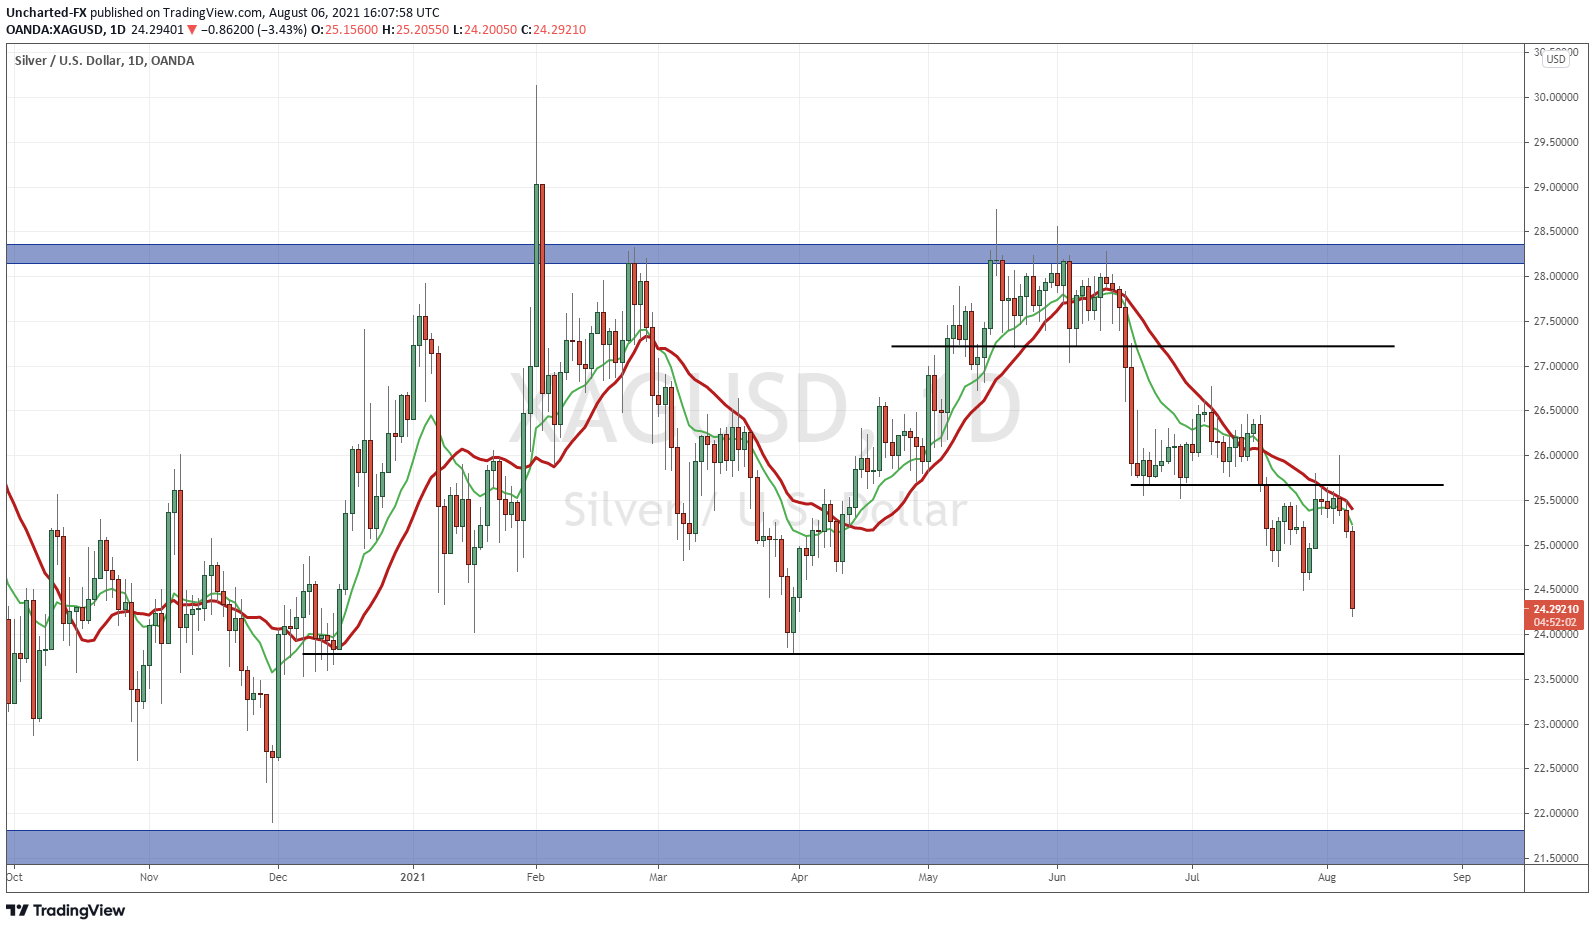
Members of Equity Guru’s Discord channel were told that a short is recommended once Silver broke support at around $27.50. The topping pattern there was obvious. We have now made TWO legs lower. This is usually the magic number I look for in order to start looking for a possible reversal and trend shift.
There seems to be some support coming at around the $23.80 zone. Perhaps next week we find some support there. I wouldn’t be a buyer of Silver near term until it breaks and closes above $25.60. That would officially end the downtrend on the daily chart.
So there is some hope in the short term, but keep your eyes on the US Dollar. I know I will.

