

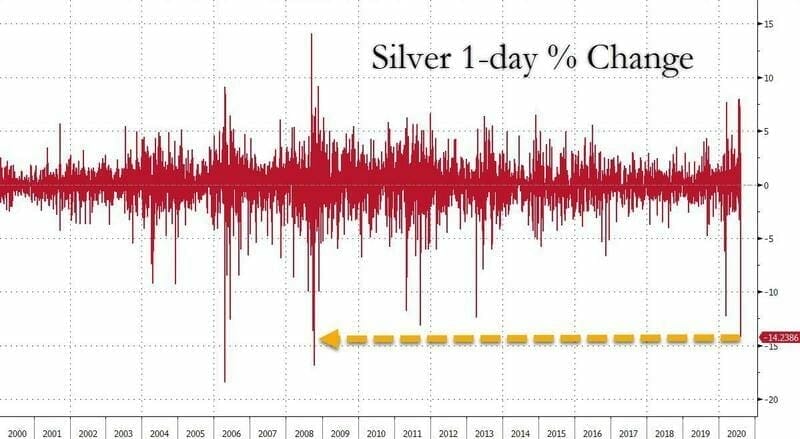
Silver had its largest drop yesterday since the Lehman Brothers event in 2008. A lot of speculation on the sell off: was it a way to shake the weak hands? Was it JP Morgan dumping a large amount of Silver? To me, it was just regular price action, but the move was very extreme. Right off the bat, this was a great way to remind us of the volatility of Silver. Yes, Silver can move 6% or more up per day, but it can also do the opposite. This volatility is why large funds rarely invest in Silver and prefer Gold for its stability. However, both still hold monetary aspects (Silver moves with a higher correlation with Gold than Copper), and why I believe Silver will be considered by larger funds in the future when the major monetary and debt crisis begin to hit us.
So I want to break down the Silver chart on multiple timeframes and do my best to paint a picture of what I think Silver will be doing next. Just remember, the higher the timeframe, the more stronger the signal. So the monthly chart will be very important.
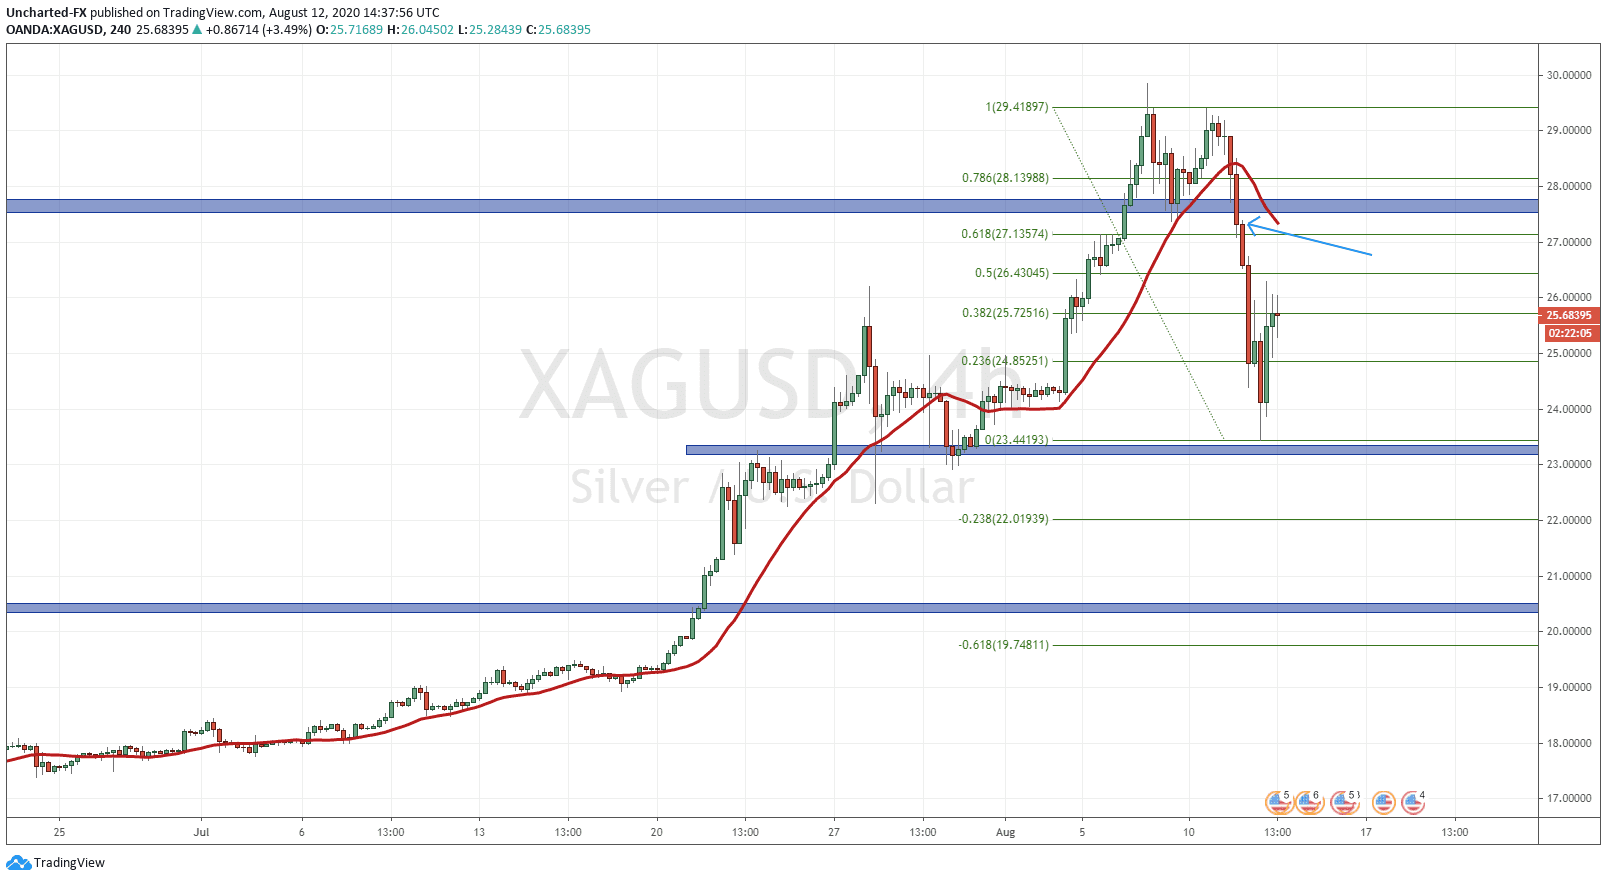
Starting on the 4 hour chart, I want to point your direction to the very top of the chart, ignoring the fibonacci levels for the time being. We can see Silver was clearly in an uptrend until it reached the 29.80 zone. Price came back to retest our large monthly support level at 27.50, and we could have expected another higher low to form with the confirmation being new higher highs. What happened instead? We hit previous highs but failed to break above. With the wicks from the candles, we could see that the sellers were stepping back in. What we did is then create one of the quintessential reversal patterns that my readers are familiar with: the double top (an “M” shape pattern). The most important criteria is that this pattern must appear in a well defined uptrend, which we have.
Once we broke and closed below the support line at 27.50 (the arrow points to that candle), it triggered our double top pattern. This was put out and mentioned to the members of our discord trading channel. Big move and gains followed in a single day. My target was the 24.40 support zone on the 4 hour. We cut through it.
There is now a possibility we make one more leg downwards by forming another lower high. This is where we now turn to fibonacci. We generally expect price to reverse at the 38.2, 50, or 61.8 level. The 61.8 being the line in the sand, and if price break above it, the downtrend is broken, while a reversal at the 38.2 fib points to a very strong trend. We can see that price is currently reacting at the 38.2 fib, meaning this downtrend is strong. Sellers are stepping back in very quickly. We will watch to see if the 4 hour candle closes below the 38.2…but from all the wicks we are seeing, we know the sellers are stepping back in. To nullify this, we would need a close back above the double top neckline at 27.50 which coincides with a break above the 61.8 fibonacci.
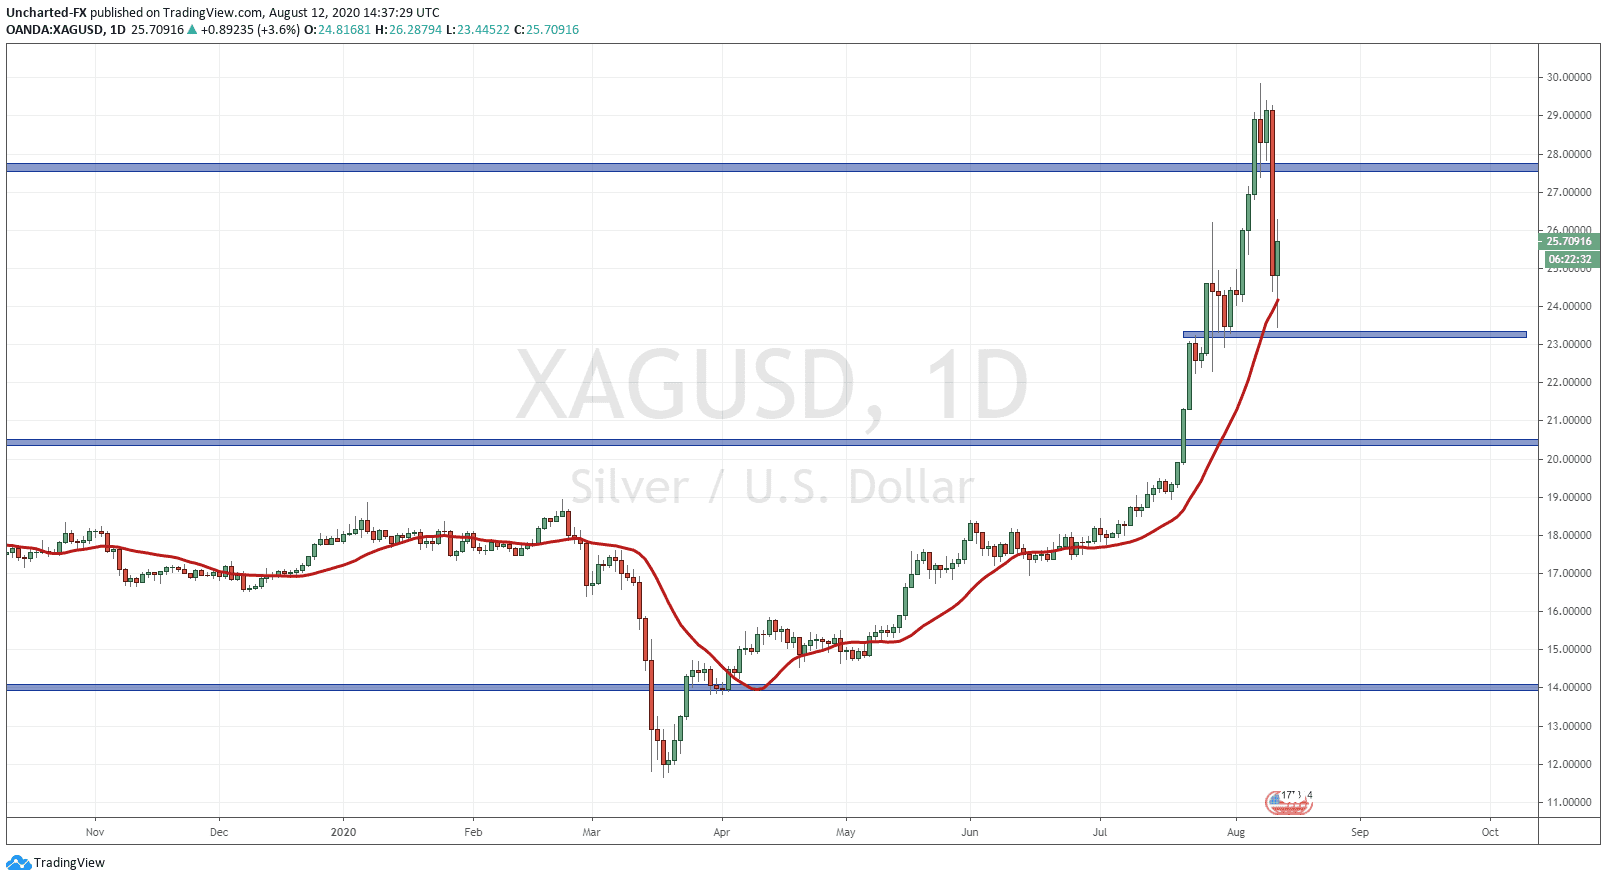
Onto the daily chart. Only one level I want to point out here, and that is the highlighted zone here at 23.00. Why is this so important? Because it was the higher low swing we are working with. According to market structure, as long as we remain above the higher low, we are still in the uptrend. This is pretty much the biggest bullish signal for Silver we currently have. A close below this would take us back to 20.50…which is a major zone on the monthly chart.
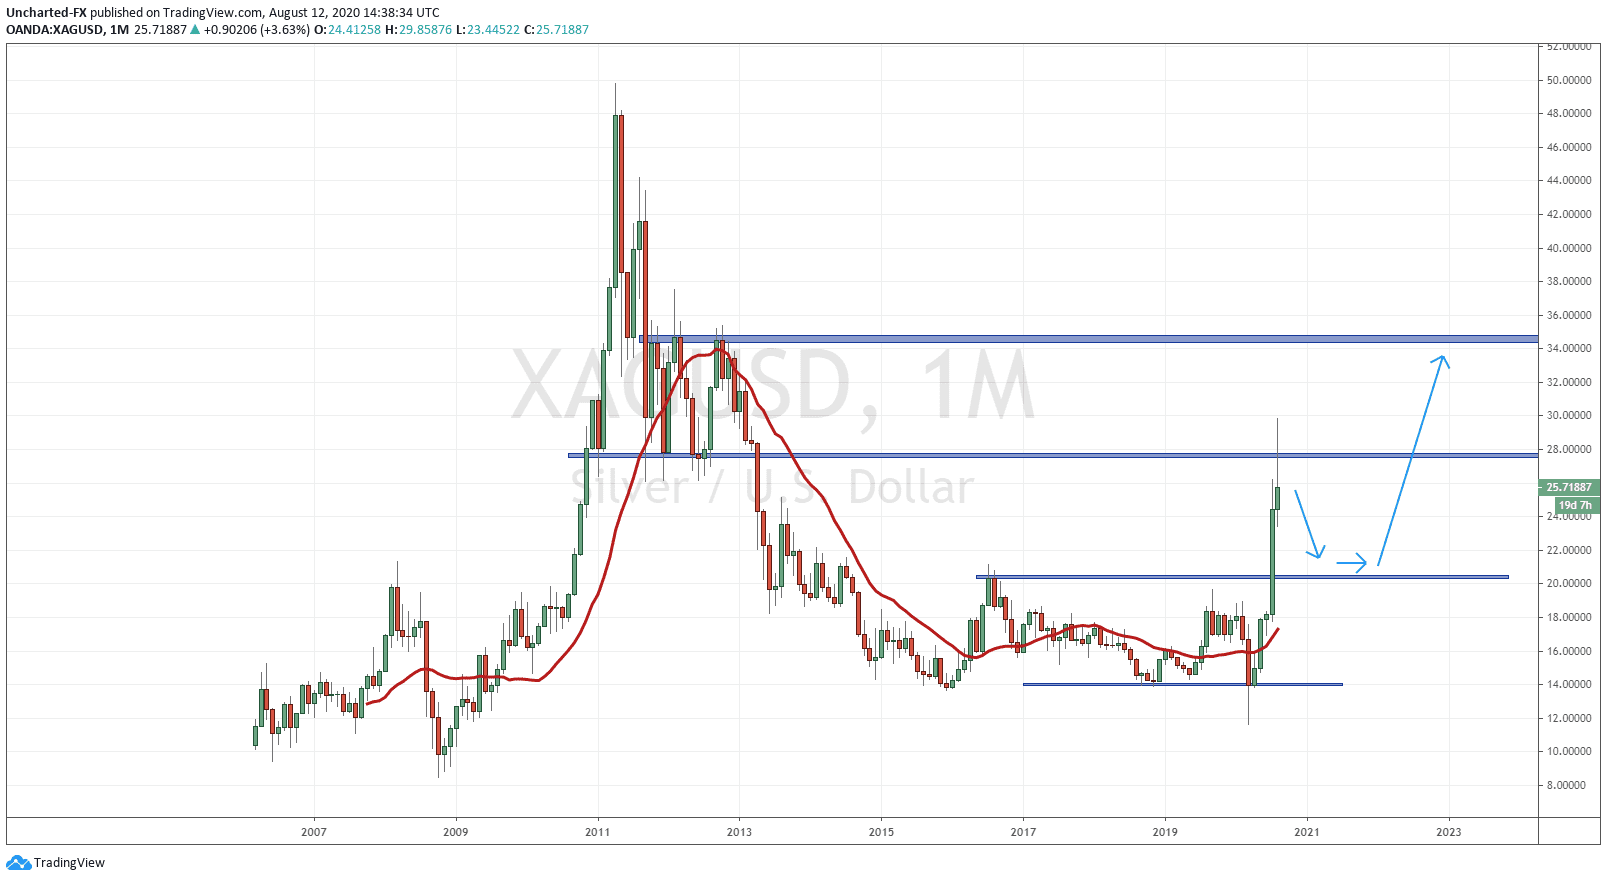
Finally, the monthly chart. My readers have seen this chart before. I used it for the breakout to target 28, and most recently, I have said I would like to see Silver pullback and retest 20.50 in the future before continuing higher. This is just normal market structure, with breakouts being retested before continuing higher. If you remember, I did say I hope the August monthly chart ends up as a pinbar (which we are currently setting up) and then September takes us back to 20.50. Perhaps in October we begin to stall at support and then in late October, early November during election time, we begin to get our move higher.
Once Silver retests this 20.50 zone, I do believe it will be our LAST OPPORTUNITY to buy Silver at these cheap prices. So this is the playbook for Silver, and why I am hoping for a pullback to 20.50. It may shake out some weak hands, but this pullback would still be BULLISH because it is adhering to market structure on the monthly chart.