It feels like ages since I spoke about the GDX and the GDXJ, and how we added to our positions on the major breakout…but this is the reality of swing trading. We enter, and we allow market structure to play out. If the readers recall, those trades were triggered on the weekly charts, which means our analysis on where to take profits, or whether to exit will be assessed on said chart timeframe. The weekly automatically implies a longer term hold, as we do not get emotionally triggered by moves on the smaller timeframes.
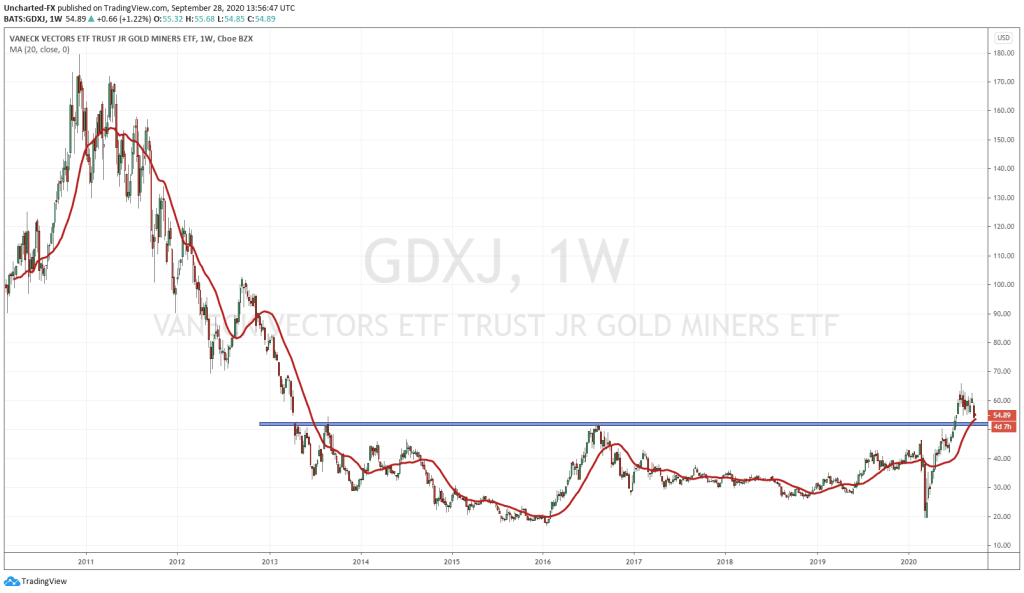
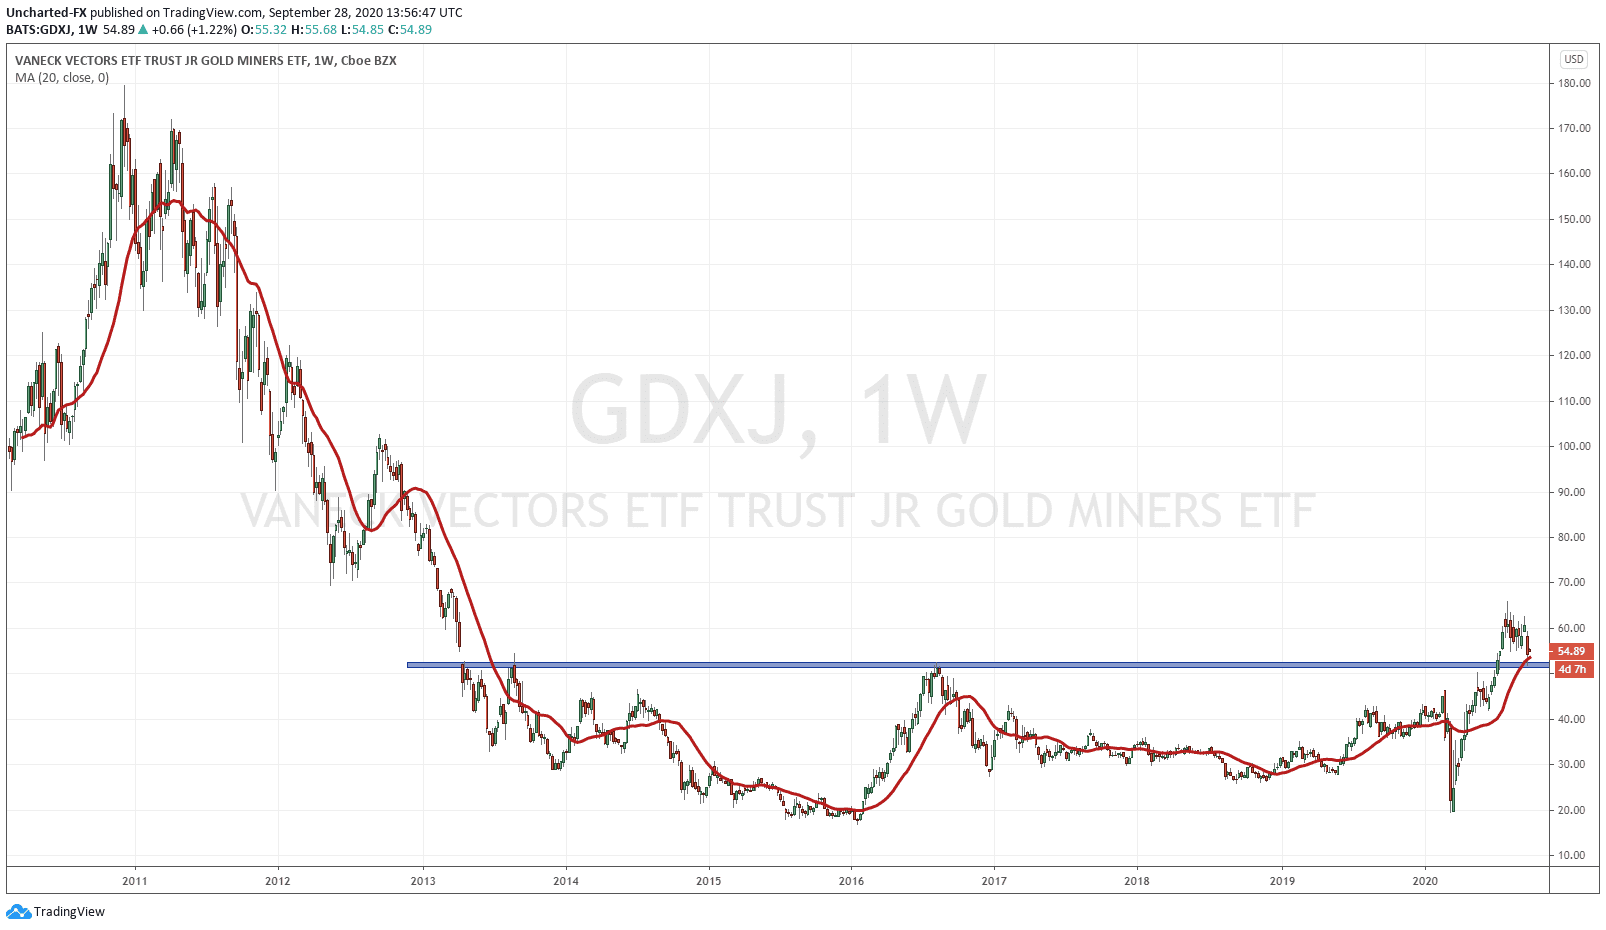
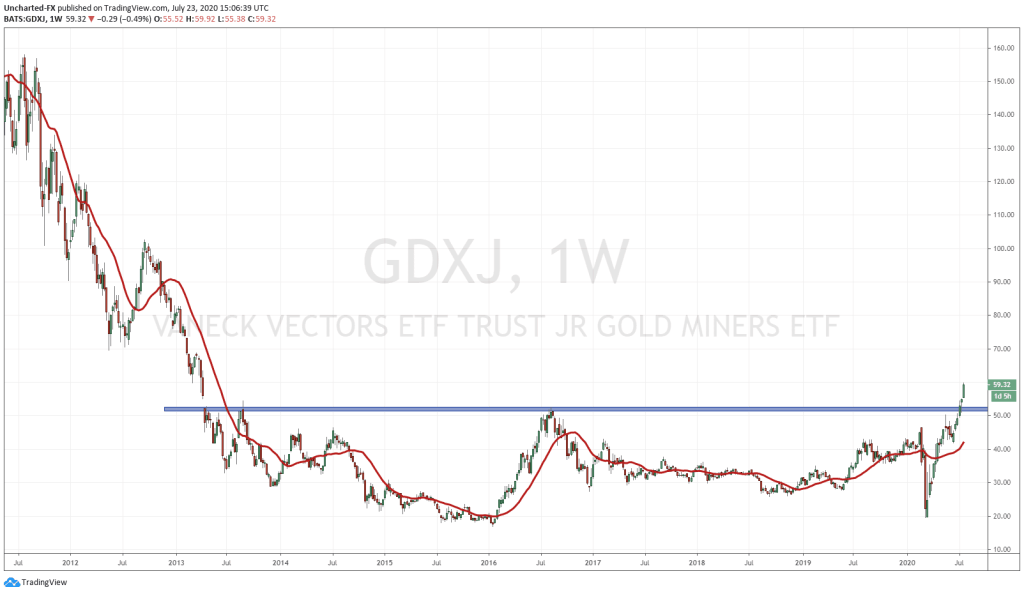
Just a quick reminder on the GDXJ, and it is the same pattern we have used to trade GDX, Gold, Silver, Pure Gold, East Asia Minerals, Nexus Gold and many more. This is my favourite pattern as it illustrates market structure with a textbook example. All markets can only move in three ways: uptrend, range and a downtrend. In this chart we see a downtrend, and then a long range going back to 2013, and finally the breakout which occurred this year. The uptrend is what we are betting on right now, with price to make higher low swings all the way up to 100.
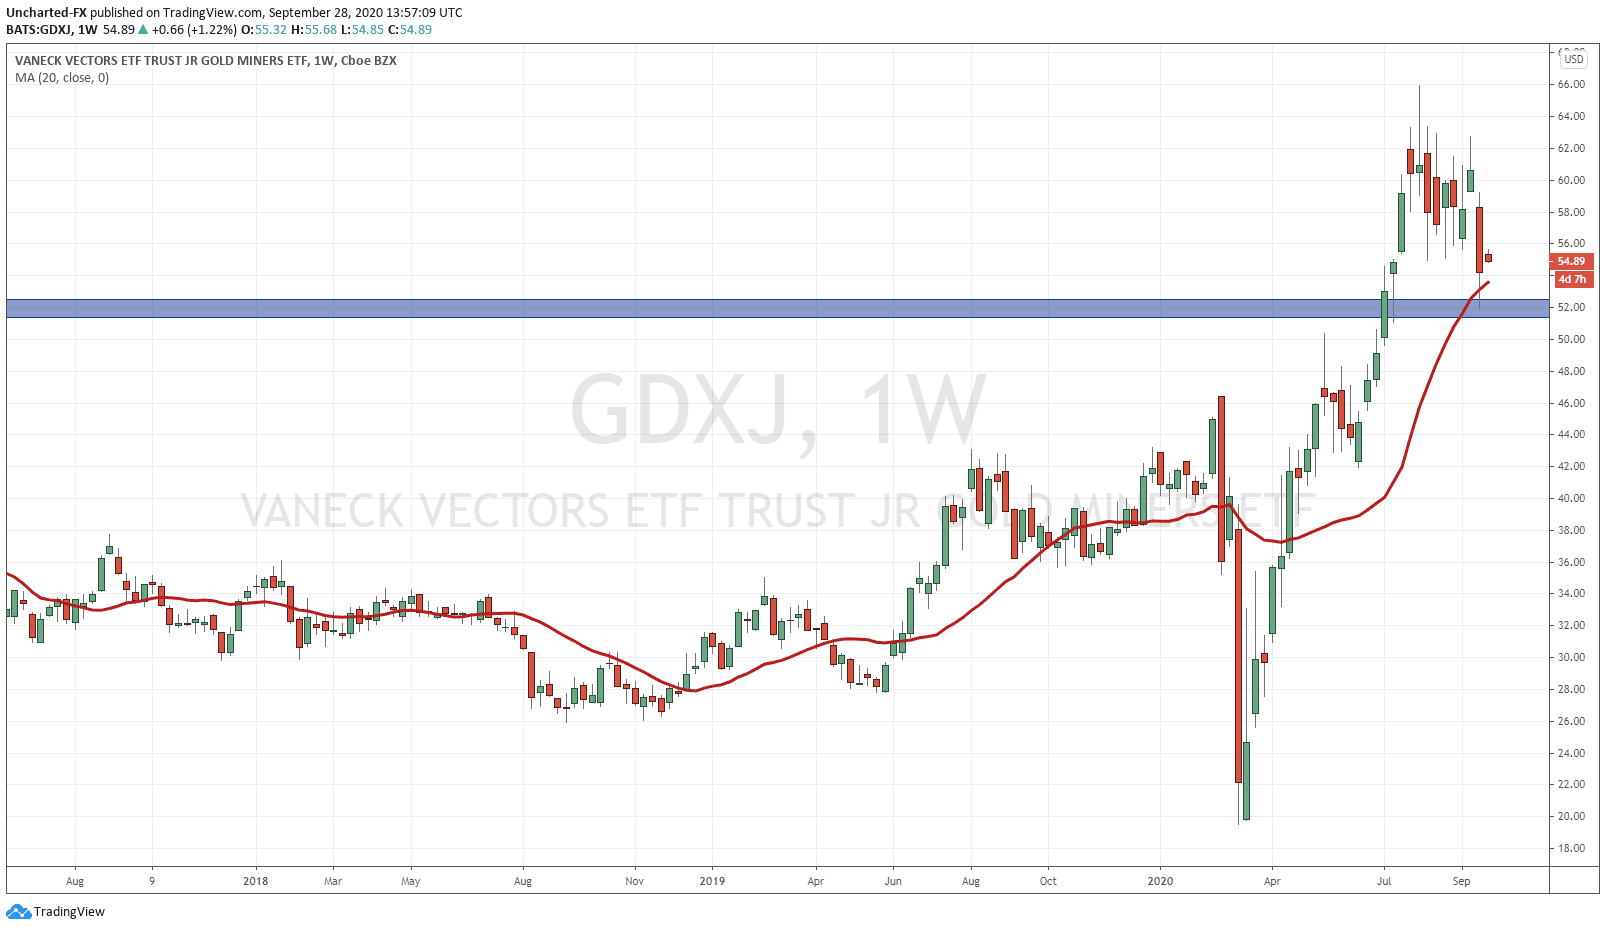
What is normal for breakouts is the fact that price retests breakout zones before bouncing off and then continuing higher. As you can see from the chart above, we have yet to retest this breakout zone since the breakout in the first week of July. Until last week and this week. Price came down to our support/breakout zone last week, and we are still holding this zone. Remember, we MUST remain above this zone with a weekly close, to maintain this uptrend. If we close back below, then the breakout has been nullified and we then print a fake out pattern.
Zooming in to our zone, we can see last weeks candle close did print a wick indicating that buyers did indeed step in to buy and defend our 52.00 zone. This is a good sign. However, we would like to see a much stronger signal printing by the weeks candle. We will not know until the end of Friday, but let us go through 3 quick scenario’s:
- We actually do get a candle CLOSE below this zone. This would not bode well with my thesis on junior miners going into a mania. A close below would sap a lot of the interest and the movements in this space.
- The candle we form turns out to be something like a doji, or a candle which shows indecision. Basically nothing of note happens, and we just see evidence of a battle between the bears and the bulls. The zone remains important, but we would have to watch the next weeks close.
- Price does print a nice green candle, or something indicating the buyers are stepping in and defending this zone. This could even play out with price selling off for a few days before reversing in the last days of the week. This would print a green candle with a nice wick.
If we get option 3, or even 2, one can either add to their position on the GDXJ, or enter for the first time here with a stop loss below this weeks candle close! This means you would be entering early next week as we need to wait for Fridays close. This is why patience is very important! Do not feel like you have missed out because price generally retraces eventually! Even if you did enter before and now are in the red on this retest, you wouldn’t be in the red by very much, but this is the price action we have expected. Price does not move in a straight line! In a trend, price makes swings which are composed of pullbacks before moving higher!
So in summary, this zone is very important for the GDXJ. We must remain above it to maintain our bullish stance going forward! All eyes on Friday’s weekly close!

