A great day to write about Gold. After the major event risk that was the Federal Reserve Interest Rate Decision, we have a clearer picture on Gold. In this article, I want to focus just on Gold, but you can also include Silver in this discussion. Gold’s little brother is also at a huge support zone which I will cover in a future Market Moment so be sure to check Equity.Guru for it.
The Federal Reserve meeting can be summarized with these three points:
The Fed doubled the pace of the taper to $30 billion per month
The Fed blames elevated inflation on “supply/demand imbalances”
The Dot Plot shifted dramatically, showing The Fed expects 3 hikes in 2022 and 3 more in 2023.
Overall a quite hawkish statement right? Yes, but in my opinion, the press conference sounded a tad dovish. Traders on Twitter lamenting that it is the good cop/bad cop routine…or the hawkish chairman/dovish chairman routine. What really would get markets a bit worried are interest rate hikes. Yes, the Fed is planning to aggressively dial back on their monthly bond buying purchases, but rate hikes are still ways away, and anything can change from now until then. The Fed did mention the uncertainty due to Omicron and other variants. To me, it just seems like kicking the can down the road which I was expecting. Can the Fed even raise rates up to 1% with all the debt the government has?
The plan now is to end the purchasing program by March 2022, and then the Fed and the market will be thinking rate hikes. Right now, the traders and markets are calling the Fed’s bluff. Leads me to think back to Stanley Druckenmiller saying that stock markets are going to continue higher until the Fed actually takes meaningful action.

The US Dollar actually fell on a hawkish Fed, when traders thought it would do the opposite. Seems like the currency markets are calling the Fed’s bluff, although Dollar bull contrarians would say the move higher was pricing in a hawkish Fed. By the way, I am in the Dollar bull camp. I have written about the trap central banks are in. We are heading into a currency crisis/war and the US Dollar will be the winner being the safe haven. That in itself will cause other problems due to Dollar denominated debt. This would cause a confidence crisis in governments, central banks and the fiat currency. When confidence is being lost, both the US Dollar AND Gold can move up together. This is our sign for when sh*t is hitting the fan, but for now, we stick with the negative correlation between the US Dollar and Gold.
Going to mention another billionaire here. Ray Dalio has been recommending funds to consider a 5% allocation in Gold. He sees it as the best currency given what central banks will do.
This brings us to the inflation question. The Fed is blaming supply chains, but we contrarians are saying it is because of the money that has been printed. We are in a situation where there is more money and people with more money competing for the same number of goods and services. Productivity is not increasing which is required for stable or little inflation when money supply is growing. I have told this story many times, but many people I know are trading. They have left their jobs and are now day trading and swing trading and making loads of money. Let’s be honest, we traders aren’t necessarily adding anything productive to the economy.
The worse case scenario for me is the Fed preparing to combat inflation…meaning they will have to raise interest rates very quickly in a short period of time. Remember, this would happen with the Fed telling us this inflation was transitory…but not anymore. They have bought some time by saying inflation will persist into the second half of 2022. If inflation numbers remain elevated into next year…markets may begin losing confidence. Put it this way: the Fed cannot get ahead of inflation by raising rates to 1% if inflation is running close to 6%. They would need to raise rates above that which would probably bring down the financial system. It would be biblical to be honest. Let’s hope that isn’t going to happen.
My definition of inflation has been with the monetary aspect. Inflation is when a currency is weakening hence it takes more of that weaker currency to buy something. Yes, there is some psychology behind it because if people believe the currency will weaken in a week or a month, they will purchase goods soon. This brings us to money velocity which has been a hot topic between Cathie Wood and Jack Dorsey. In a hyperinflationary scenario, people spend the currency right away because they believe they will be able to purchase less that day after. Money velocity is through the roof. Let’s hope that doesn’t happen, but I do expect assets to continue to move higher as people chase yield to beat inflation. Preserving purchasing power becomes key, which is why Gold is seen as the inflation hedge. To me, it is the best CURRENCY to hold. So if inflation is a currency weakening, you want to ditch fiat for non fiat assets. So let’s watch those CPI data prints going forward. If they come in higher, people will begin to doubt the Fed’s ability to combat inflation. Once again, if the Fed raises rates as much as they would have to, it would bring down the entire system.
Sort of doom and gloom, but investing in Gold is betting against the greatest debt bubble in human history. You can say the same for other non fiat assets like Silver and Bitcoin.

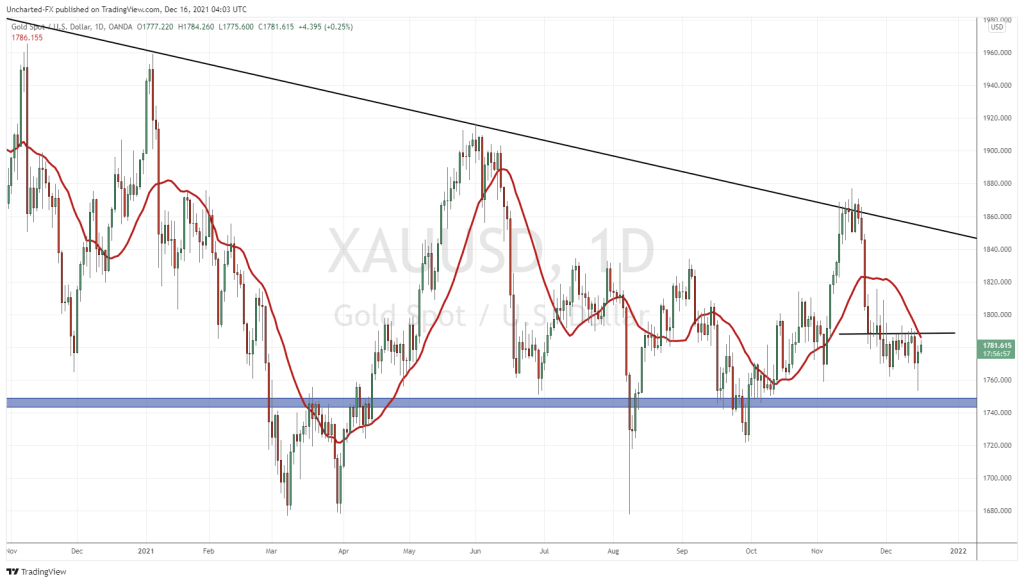
I want to start looking at Gold on the weekly chart. Yes, we have a triangle pattern, and the breakout above my trendline is what takes Gold on its next move higher. And I mean a move into new record highs. But right now, it is all about whether this support zone will be where we bounce before breaking out above the trendline. $1750 is a very important flip zone, or a zone that has been both support and resistance, on the Gold chart. We are testing this zone right now. The weekly candle is showing a nice bid, but remember, it does not close until Friday. If we get a nice green hammer candle close, it would be a great sign for us Gold bulls.

Zooming down to the daily candle chart, and readers can see we have something to work with. Yesterday’s fed candle gave us a large wick, and at our $1750 zone. A positive sign that buyers are stepping in here. However the trigger for us to either initiate a long, or add to our long (one could enter long now but I would recommend a smaller position) is a daily close above the $1790 zone. It would take out this price range we have been in for the last 2-3 trading weeks. A breakout in technical terms.
Things are still looking good for Gold. Let’s quickly look at the GDX and the GDXJ.


See the similarity, and trust me, you will see this with other Gold charts in just a minute. Both the GDX and the GDXJ are also testing a major flip zone as support. The next few days will be crucial in determining whether buyers defend and take us higher, or if the sellers cause a breakdown. It all will come down to Gold holding above $1750.
When Gold moves, Gold stocks are leveraged to the price of the metal. I prefer holding the physical, but gains are made from juniors, miners, royalty and streamers etc. Which takes me to an article I wrote earlier this year titled “How I Invest in Gold and Silver“.
| GLD ETF | Royalty Streamer | Mining Operator | |
| Limited Exposure to: | |||
| Capital Costs | YES | YES | NO |
| Operating + Other Costs | YES | YES | NO |
| Benefit of: | |||
| Leveraged to Gold Price | NO | YES | YES |
| Exploration + Expansion | NO | YES | YES |
| Dividend Yield | NO | YES | YES |
The chart above and that article will explain why I prefer Royalty and Streamers. I really believe the metals are at a huge support zone, and investors should consider picking up some Gold stocks around here. For the newer folks in this space, I would recommend the royalty and streamers just because they are good companies. Companies like Franco-Nevada, Royal Gold, Wheaton Precious Metals, Osisko Gold Royalties, and Sandstorm Gold to name a few.

Speaking about Sandstorm Gold (SSL.TO) we are also testing a major support zone. Once again, most Gold charts are providing us with this support entry opportunity.
In our latest Gold Investor’s Roundtable on Youtube, we covered a few near term Gold producers. I won’t go in too much detail about their chart since they look the same as those covered above. But for those wanting a more in depth look at these companies, I suggest watching our video on Youtube. We spoke about Gold Mountain, Sabre Gold and Ascot Resources.


Ascot and Gold Mountain are testing major support zones. Gold Mountain will have a big day just like Gold and the Gold ETFs. If Gold breaks down, Gold Mountain breaks a major support and tumbles. Ascot is near its major support zone of $1.00, but we are seeing a nice bid around $1.05. Five trading days worth of nice large wick candles indicate buyers stepping in around this zone. Sabre Gold is a bit different as it isn’t necessarily testing a previous support zone rather it is consolidating and ranging.
In summary, Gold is holding above a major key support level. Yesterday’s candle is a good sign that buyers will step in to defend this support zone at $1750. In the upcoming days, we could consolidate and range, touching $1750 once again. But we Gold bulls hope to get that breakout. If so, then the ETFs and the Gold stocks mentioned bounce from their support zones.