

Gold prices against fiat currencies are printing new all time record highs. The only pairing which has not yet printed record highs is gold against the Swiss Franc, but it is almost in new record high territory.
In this article, I will provide a technical game plan to play gold. But first off, let’s talk about quick fundamentals.
In my gold article last week, I highlighted the reason why gold is printing new highs. But, we can look at four points:
- The mainstream financial media reason that gold is rising because interest rates are about to come down.
- Gold confirmed a breakout just as CNBC put out an article stating the US national debt is rising by $1 trillion about every 100 days. Thus, the move in gold and bitcoin can be seen as betting against the debt.
- Central banks are buying gold. Geopolitically, many Eastern nations saw the US and the EU freeze Russia’s foreign reserves. China, India, Saudi Arabia (and other BRICS nations) are likely reconsidering holding assets in US Treasurys and diversifying into gold. A bigger picture play here which may lead to a fall in confidence in the US Dollar.
- A fear trade?? Shaky system, geopolitical triggers in the Middle East and Eastern Europe, and inflation surprise.
As I stated in my previous article (check that article out for a deeper dive), gold has been performing quite well despite high interest rates and even a strong US dollar. Therefore I don’t really buy the MSM reason that gold is up because investors are betting on interest rates to come down.
I feel the other three points I mentioned above are more likely reasons why gold is rising. Partly bitcoin too minus the central bank point.
These points are key to determine whether this gold break will sustain. By the way, we do get US inflation data on Tuesday March 12th 2024.
Let’s take a look at the chart and form a plan of action.

Gold has been on a ripping rally after breaking out of a flag pattern on February 28th 2024. We subsequently took out previous record body closes around the $2080 zone.
The first thing I suggest: DO NOT CHASE. DO NOT GIVE INTO THE FOMO.
This is the most important lesson I have learned in many trading and investing years. You do not want to buy when the move is up multiple days in a row. Avoid giving into the FOMO. Wait for a pullback or retracement to enter the next leg.

Ideally, we would want to see this. A pullback to retest the $2080 zone. Here is where plenty of new buyers would enter. If gold happens to close below this zone, then we can say gold has pulled off a fakeout and the bears are back in control.
But with this kind of momentum, we may not see gold pullback all the way to the $2080 zone. Instead, we may see buyers enter after one or two daily red candles.

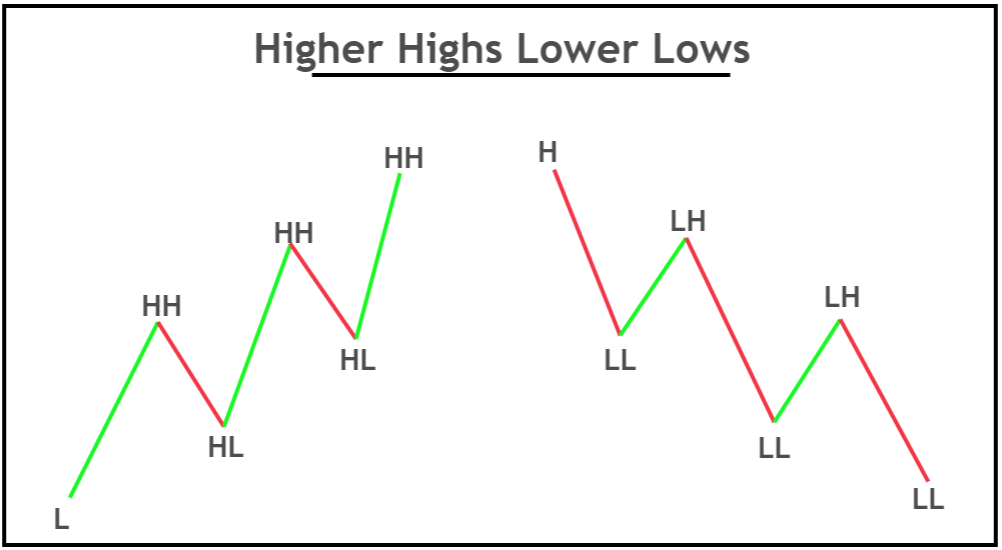
Going down to the 4 hour chart, we can see some levels we can work with. Many of my readers know I favor market structure. Current trends remain intact as long as certain levels remain in play. In an uptrend, these levels are called higher lows.
On the 4 hour chart, we can see a higher low come in at the $2150 zone. If gold pulls back to this zone, watch to see if buyers will step in here to continue the momentum. If we get a close below, then a deeper pullback/correction is likely.

When we see a 4 hour test, one can go down to the intraday 1 hour or 15 minute charts to watch for signs of buyers entering here. One could buy on a sign of strong buying, or, and what I prefer, is wait for the recent high to be taken out after the pullback.

So where does gold go next?
There is one target provided by Peter Boockvar, chief investment officer at Bleakley Financial Group. When adjusted for inflation, gold set an all time high of about $3,200 in 1980.
When assets make jumps into new all time record territories, they tend to find resistance at whole psychological numbers. In this case those would be $2250, $2500, $2750, and $3000. I favor $2500 and $3000 more.
Finally, I drew out a fibonacci and you can see the two price targets it has come up with: $2358 and $2695.
Once again, let’s wait for that pullback before jumping in.

Silver is interesting. We have had a pullback to test the breakout zone near $23.50 and buyers jumped in. Pretty bullish. I am sure traders have nestled their stop losses below $23.50 and are targeting $25 next and targets above $26.