

Hold up Bitcoin! Gold wants to join in on the party!
Gold futures for April have hit $2,126.30 per ounce, the highest level dating back to the contract’s creation in 1974. Yes folks, gold has hit its highest level ever.
When adjusted for inflation, gold set an all-time high of about $3,200 in 1980, according to Peter Boockvar, chief investment officer at Bleakley Financial Group.
“We’re still a ways away, which then also points to the potential upside,” said Boockvar, who thinks gold will also test the inflation-adjusted record.
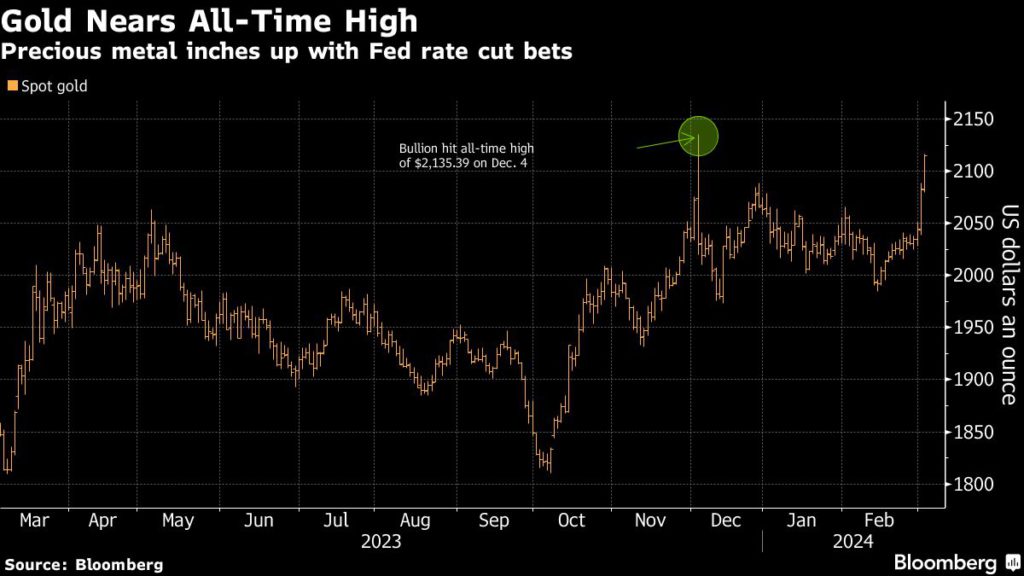
What is the reason according to mainstream financial media? Yup you guessed it. Gold price is rising higher as investors and traders bet on interest rate cuts. The reason is as rates fall, gold prices typically rise as investors seek a safe haven as assets such as bonds become less attractive because they no longer deliver attractive yields.
But personally, I don’t know about that. Gold has been performing quite well despite high interest rates and even a strong US dollar. Perhaps there’s another reason why money is running into gold.
One reason is that central banks are big buyers. In 2023, central bank gold buying topped 1,000 tons which was just short of the 2022 record.
It also seems that gold is acting as a safe haven from the safe haven (the US dollar). After Russia saw its foreign reserves ($300 billion) confiscated by the US and the EU, you have to think that other nations such as China, India, and Saudi Arabia to just name a few, are probably reconsidering having all of their assets in US Treasurys. I just realized the nations I mentioned are part of the BRICS alliance and there has been talks of a gold backed currency from that bloc.
You can also throw in the fear trade here. When things look shaky, money tends to run into gold. You can look around the world and find some unsettling geopolitical triggers in the Middle East and Eastern Europe.
But I think there is another major reason. A reason which traditionally sees gold rise. The US debt is going in a death spiral.
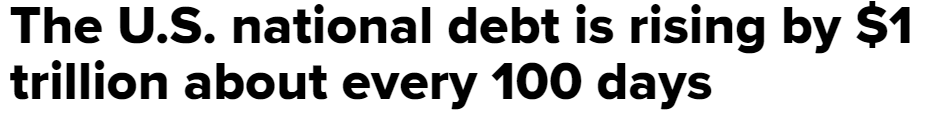
This article came out last week on March 1st 2024. $1 trillion in 100 days. I mean just think about that.
The US’ debt permanently crossed over to $34 trillion on Jan. 4, after briefly crossing the mark on Dec. 29, according to data from the U.S. Department of the Treasury. It reached $33 trillion on Sept. 15, 2023, and $32 trillion on June 15, 2023, hitting this accelerated pace. Before that, the $1 trillion move higher from $31 trillion took about eight months.

You can make a strong argument that both gold and bitcoin are rising on the debt trade.
Sure, Bitcoin has the ETF catalyst, but both gold and bitcoin are seen as ways to bet against the debt. The core of bitcoin was to be an asset out of the hands of big government, big banks, and big corporations. Some may hate this term, but you can call it ‘digital gold’.
On the day I am writing this article, Bitcoin has hit new all time record highs. I talked about this likelihood in a recent Market Moment article.

When it comes to gold, a lot of gold bulls are in it because they are betting against the debt. Not a surprise to me that gold began its major breakout on the day this CNBC article was posted (March 1st 2024).

If we start off on the weekly chart, you will see that gold printed a record candle close for the month of February 2024. The candle body confirmed this record close with a close above $2071.

March 1st price action confirmed a major breakout with strong follow through and momentum. We are about to test bullion price highs.
But what comes next?
Just simple breakout analysis in play. Breakouts tend to pullback to retest the breakout zone which sees new buyers step in and carries the price higher. We could see a pullback to the $2070-$2080 zone which would attract new buyers. And some traders may add to their long positions here (like me!). But again: on the retest we need to see evidence of buyers stepping in such as an engulfing candle or a large wick. If gold fails to hold the retest zone, we would have a false breakout and the bears would have control.

Going down to the 1 hour intraday chart, you can see that some profits on gold are being taken here with the large wicks being printed. I want to say this does not mean a pullback is definitely happening, but when we see multiple wicks like this, it tends to be a telling sign.
The trigger for a deeper pullback would be a close below the higher low at $2120. If gold does not close below this on the 1 hour chart, the uptrend still has room to ride higher.
So what are the targets higher? $2500 comes to mine and then $3000. Major psychological levels.
Before I end this article, let’s take a look at Silver.

As they say: silver moves like gold but on steroids. When gold moves, silver tends to move with it. Rather than with copper even though silver is mostly used for industrial purposes. It moves with the monetary metal.
A major breakout has been confirmed. I am watching this pullback and as long as silver remains above $23.50, the breakout is intact and we move higher to my next resistance zone at $25.

I am watching the 1 hour to see if a deeper pullback occurs, or if silver can close above $24 for the continuation and I will nestle my stop loss below the breakout zone support.
Happy Trading.