
When Nvidia blew out earnings, many saw it as a catalyst to see stock markets break out higher. However, certain technical patterns and levels I have been highlighting in my Market Moment articles told my readers and I that the downtrend was not over. This, I believe, is the power of technical analysis. But fundamental news headlines stated the stock market weakness stemmed from investor’s fears towards what Fed Chair Jerome Powell would say at Friday’s Jackson Hole speech.
With markets expecting the Fed to be near the end of this rate hike cycle, Powell delivered a somewhat hawkish speech. Powell called inflation “too high” and warned that “we (the Fed) are prepared to raise rates further“. Albeit the Fed would do this “carefully” essentially reinforcing their pragmatic data-to-data stance.
“We will proceed carefully as we decide whether to tighten further or, instead, to hold the policy rate constant and await further data,” Powell said in a keynote address. “It is the Fed’s job to bring inflation down to our 2% goal, and we will do so.”
“We are prepared to raise rates further if appropriate, and intend to hold policy at a restrictive level until we are confident that inflation is moving sustainably down toward our objective,” he said.
So let’s take a look at the inflation data so far:
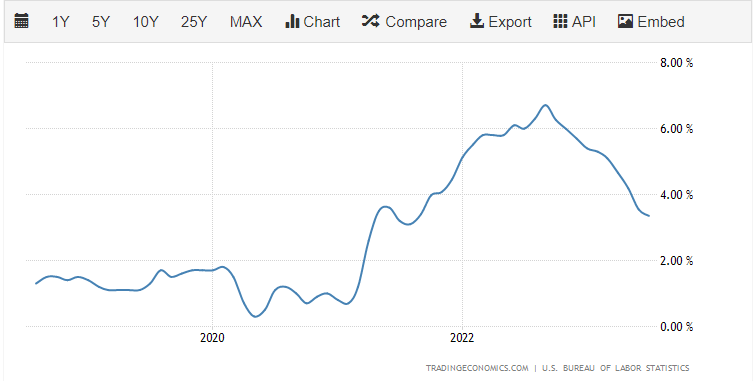
Core inflation is indeed trending lower and appears to be heading back towards that 2% threshold.
But why is there a possibility of more rate hikes? Money velocity. The economy remains robust and as long as people continue to spend more than normal, there is a chance that inflation could progress. Oh, and there is this too:

Oil is retesting a support zone and could see a breakout leading to higher energy prices which would translate to higher transportation costs and those costs being passed down to the consumer in higher prices. $77.50 is the big support zone.
The truth is that central banks want to raise rates to a level where it would slow down the economy and prevent people from spending money. They need to kill some demand. And so far robust consumer spending, US GDP and labor market data isn’t showing that:
But with “signs that the economy may not be cooling as expected,” including “especially robust” consumer spending and a “possibly rebounding” housing sector, Powell said that above-trend growth “could put further progress on inflation at risk and could warrant further tightening of monetary policy.”
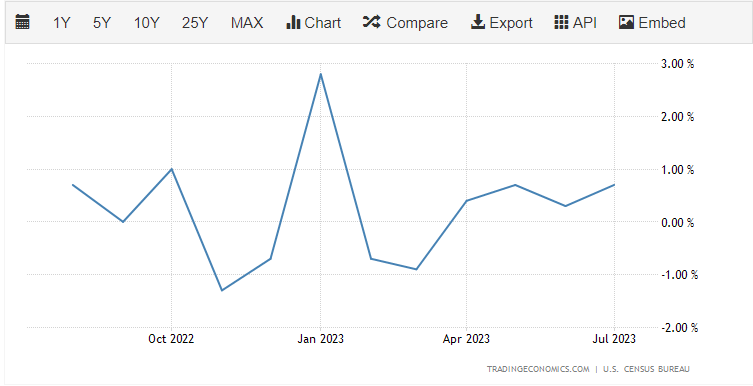
Above is the current plot of retail sales data in the US.
All of this is pointing to conflicting signals from the economy where the data is showing inflation is slowing down but the Fed’s policy may not be restrictive enough.

The next Fed meeting is in 23 days (September 20th 2023). Fed Fund futures is showing that 80% of the market believes the Fed will NOT raise rates in September. If they were to do so, we would see a volatile move in the markets since the rate hike is not priced in. And central banks tend not to surprise markets.
However, there is a better-than-50% chance of the policy rate ending the year in a 5.5%-5.75% range, a quarter-point higher than the current range. Meaning the Fed would either have one more rate hike come November or December as there is no policy meeting in October.
All of this means more uncertainty when you include other fundamental worries such as geopolitics (BRICS) and potential banking issues just to name a few.
What am I watching chart wise? Oil is one, but I continue to watch bonds:


Both the 2 and 10 year yield charts aren’t looking too positive for stock market bulls. The 2 year is about to break out and the 10 year already has and is in the process of its retest phase. A retest which should result in a move higher in yields.

When it comes to stock markets, the S&P 500 is displaying a head and shoulders pattern, a quintessential reversal pattern. We have told readers that the break below 4500 was a key turning point. This level remains the lower high we are working with. This means that the downtrend will remain intact and shorts preferred until we can get a close above 4500.

The Nasdaq almost shifted trends as it appeared we would get a strong close above 15,250. But the sellers prevented this. We are also setting up for a head and shoulders pattern on the Nasdaq forecasting further weakness.

The Dow Jones is what I am watching closely currently as it is now retesting a broken support level. What was once support has now become resistance. I do expect to see signs of sellers here. However, my trigger to short would come from the intraday 1 hour chart and a close below 34,375.