
Banks have played an integral role in our civilization since ancient Assyria merchants began loaning out grain as collateral, but until 2007, their complicated inner workings were largely a sleep-inducing esoteric mystery.
On the surface, banks are financial institutions that take deposits and make loans, while writing and accepting cheques (payment settling), but at their core, banks are a trusted third-party that facilitates commerce. Without the trust created by banks, our economy would come to a calamitous halt.
Seems that banking is a solid, revenue-generating investment opportunity for the savvy investor, but where does that leave the rest of us whose only experience of the banking process is paying bills online. How do we unwashed masses pick a good bank stock for our investment portfolio? Here are some basic ideas:
Dividends
First thing to consider is the bank’s dividend scheme. Dividends are a good portend of a bank’s success record. If they have a long history of consistent dividends, that means they have a good track record for making, if you will forgive the term, bank.
Yes, it still requires due diligence on your part and having to dig through profit and loss reports, but this isn’t cryptocurrency, you’re not investing in the coolest dog, good investment requires work. Speaking of which.
Net interest margin
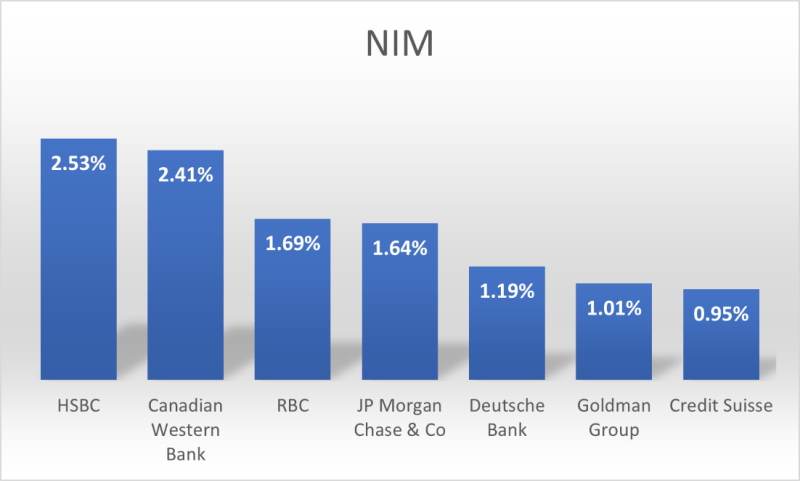
Net interest margin (NIM) is the difference between what a bank earns in terms of interest income for items such as loans and securities and what the bank pays in interest to their lenders relative the bank’s interest-earning assets.
Let’s pretend Brenda is a bank. Brenda borrowed $50 from Mary so she could loan $100 to Charlotte back in January. Since then, Charlotte has paid $7.00 in interest. Also, during that time Brenda has paid Mary $2.00 in interest. So, the formula would look like this:

Here are some real world numbers: JP Morgan Chase & Co. (NYSE: JPM) reported a NIM of 1.64% for fiscal 2021; The Goldman Group (ASX: GMG) reported an annualized NIM of 1.01% as of September 2022; Canadian Western Bank (CWB.T) reported a 2.41% NIM so far in 2022; RBC reported an annualized NIM of 1.69% as of October 2022; Deutsche Bank (ETR: DBK) reported 1.19% NIM for fiscal 2021; HSBC’s (LON: HSBA) annualized NIM was 2.53% as of the quarter ending September 2022; and Credit Suisse (SWX: CSGN) reported a NIM of 0.95% for fiscal 2021.
Return on Assets
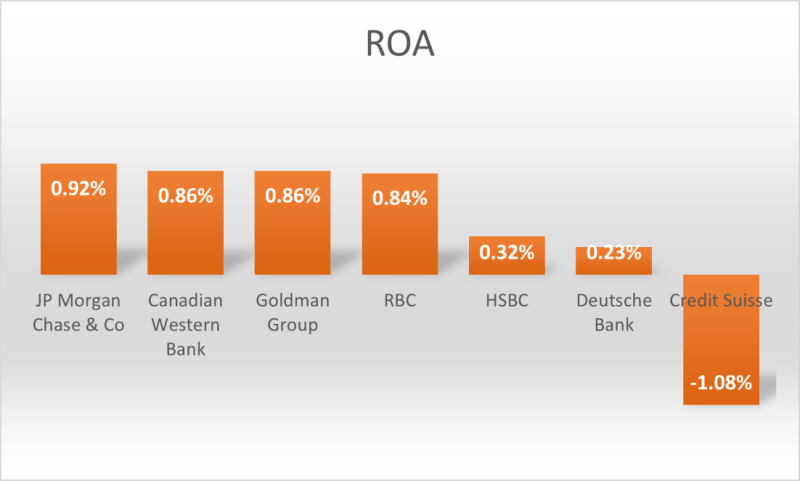
Return on Assets (ROA) is another factor you should pay attention to. This statistic reveals how much per-profit dollar the bank earned on its assets. This allows investors to compare different sized portfolios from different institutions, however, it does not measure the comparative risks between portfolios.
For example, after paying taxes, Jitesh brought home $500 in net income from $50,000 worth of loans and stock.

Using the same banks we discussed before, HSBC reported an annualized ROA of 0.32% for the quarter ended September 2022, Canadian Western Bank record a 0.86% ROA TTM, RBC reported 0.84% annualized ROA at the end of October, JP Morgan Chase & Co reported 0.92% annualized ROA at the end of September, Deutsche Bank reported an annualized ROA of 0.23% as of June 30, 2022, Goldman Group recorded an annualized ROA of 0.86% as of September 30, 2022 and Credit Suisse reported an annualized ROA of -1.08% at the end of September.
Return on Equity
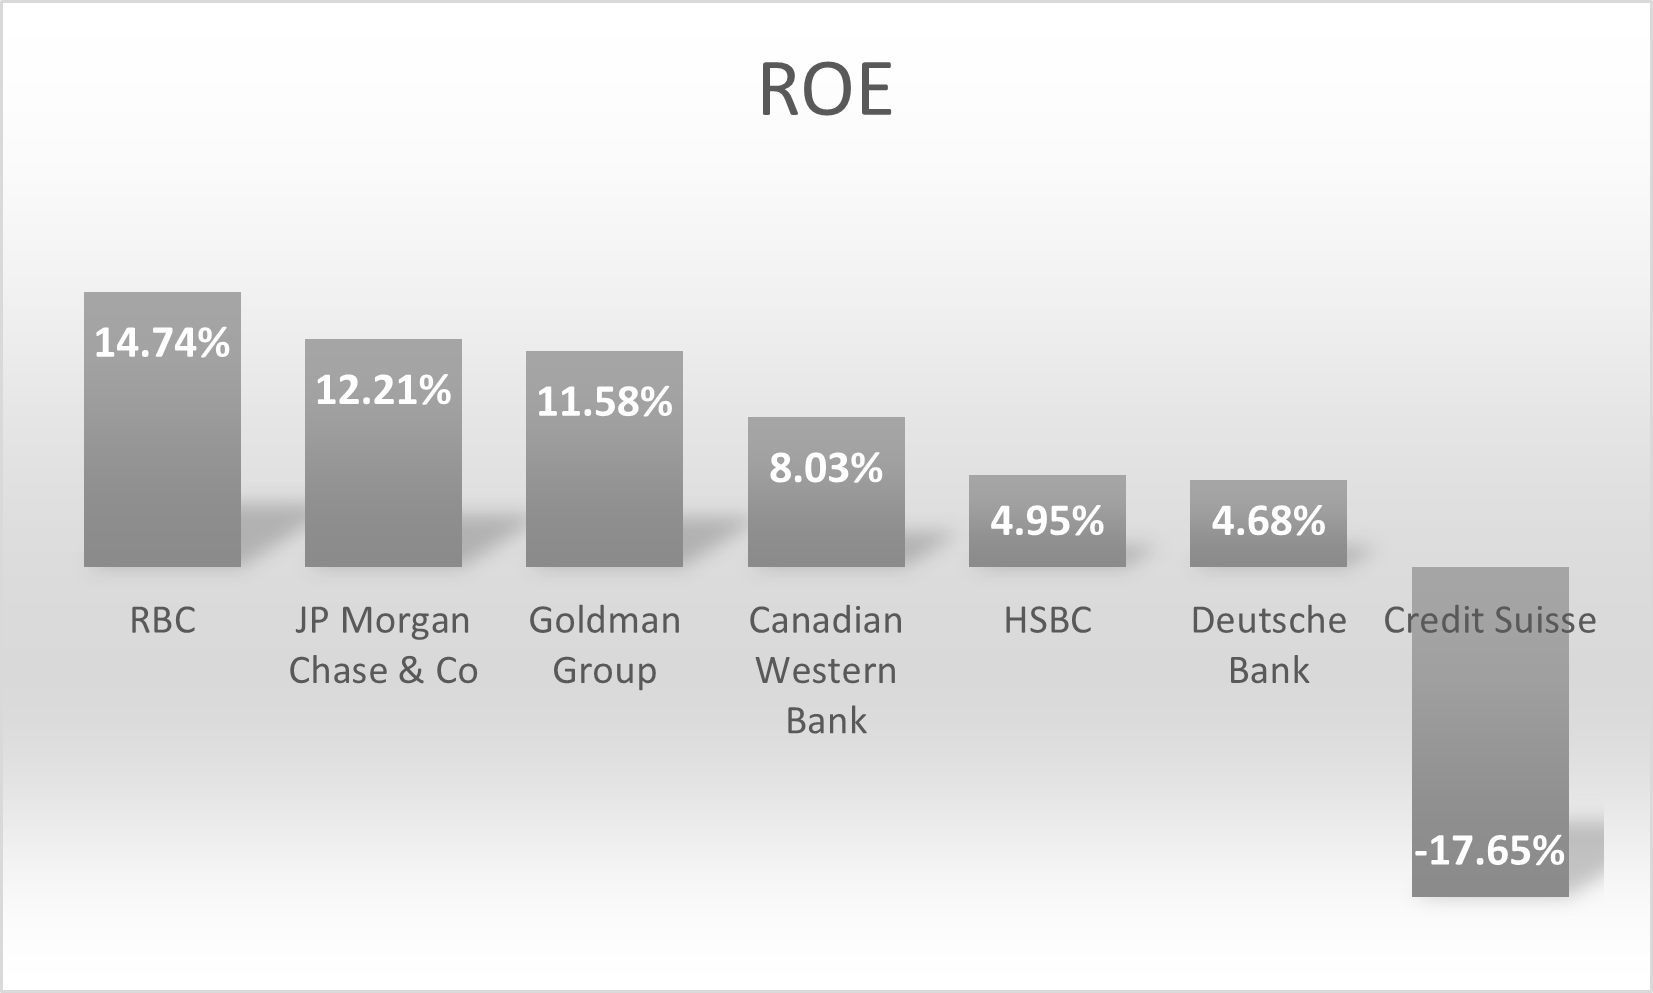
Return on Equity (ROE) measures a bank’s profitability and how easy it is for it to generate profits by dividing net income by shareholder’s equity and producing a percentage.
For example, Tim brought in $10,000 in net income this year from interest earned on family loans and securities. For Tim to get started in business, he sold 100,000 shares to friends which are currently worth a dollar each in the market. This gives Tim a valuation of $100,000 and an ROE of 10%.

In the real world, JP Morgan Chase and Co reported an annualized ROE of 12.21% at the end of September, Canadian Western Bank reported 8.03% annualized ROE as of October 31, 2022, Goldman Group recorded an annualized ROE of 11.58% at the end of September, RBC reported 14.74% annualized ROE at the end of October, HSBC reported an annualized ROE of 4.95% as of March 31, 2022, Deutsche Bank reported 4.68% annualized ROE at the end of June, and Credit Suisse recorded an annualized ROE of -17.65% for the period ending September 30, 2022.
What Does All This Mean?
You could combine these metrics to find the institution that rates the highest overall like in the following graph chart:
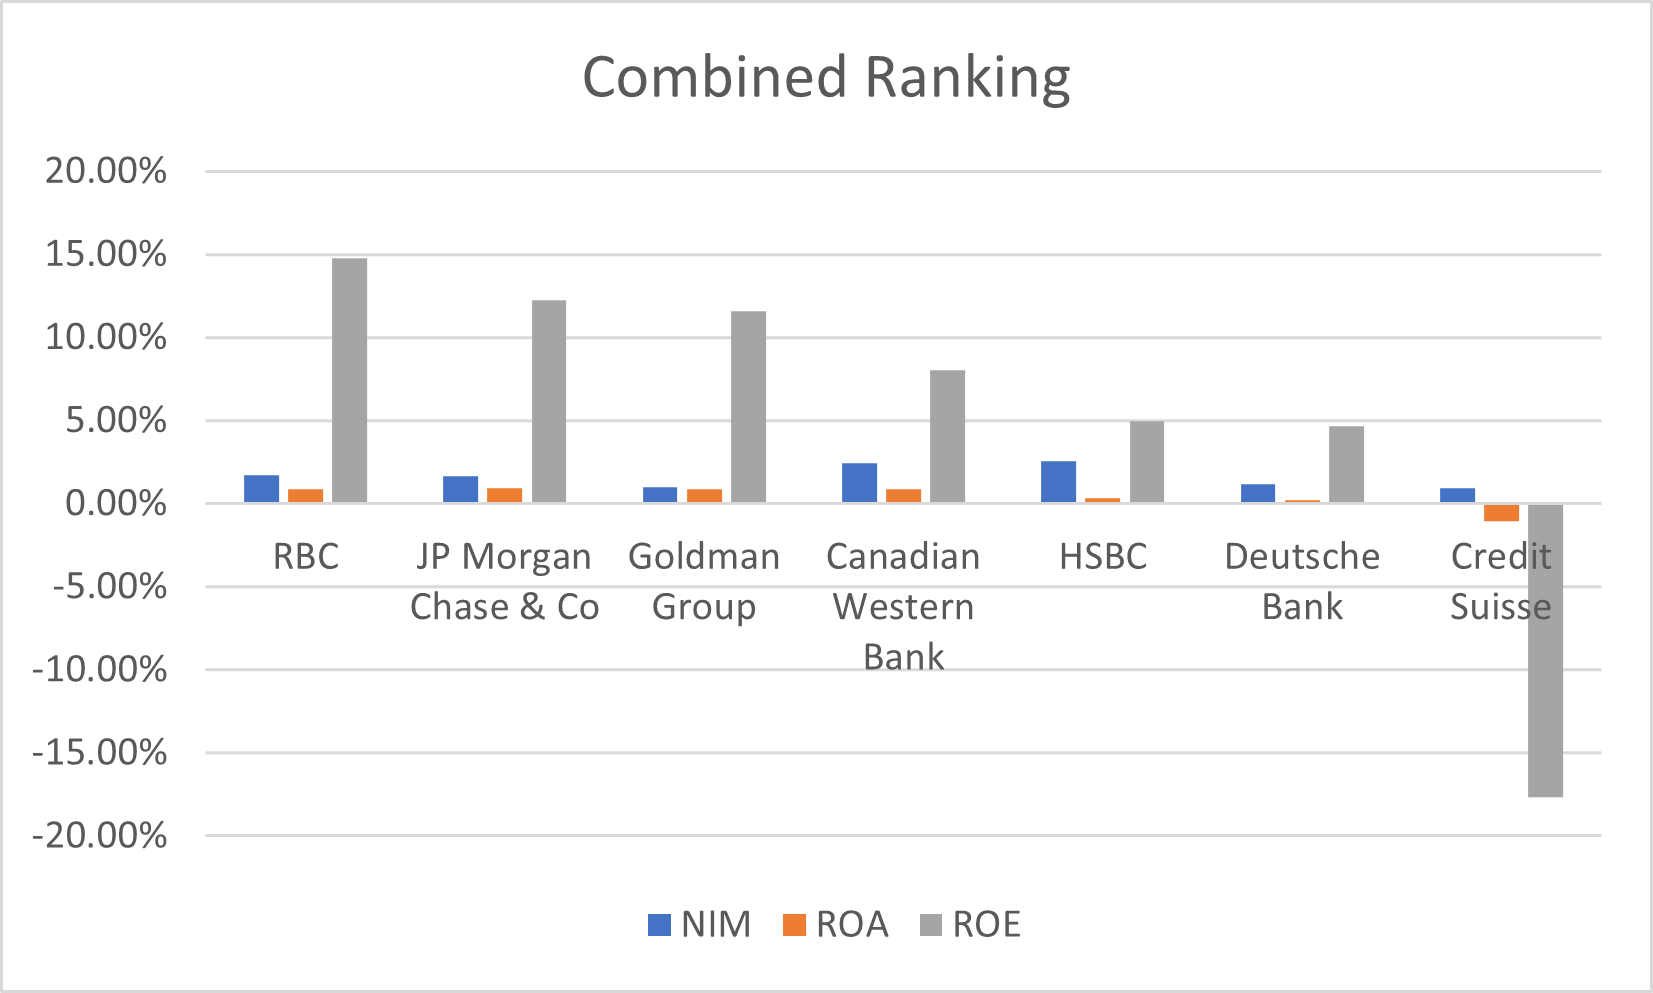
As you can see, RBC ranks first with JP Morgan, Goldman and Canadian Western Bank, relatively close behind, backed by HSBC and Deutsche Bank, while Credit Suisse hangs dangerously off the end. Does this mean that you should automatically invest in RBC and forget the rest? Not a chance. There are more metrics to consider, such as loans-to-asset ratios to determine the bank’s main line of business, risk ratios such as adjusted risk return on capital and loans to deposit ratios to determine liquidity.
So, using these tools coupled with professional investment advice, you will be able to make a better informed decision with adding the banking sector to your investment portfolio so that you too can capitalize on our financial infrastructure.
–Gaalen Engen