
Lately I have been ticking off the gold and silver bulls. I must state again: I am still loading up on physical precious metals. Their time to shine will come when we get deeper into the confidence crisis as people begin to lose confidence in the government, central banks and fiat currency. Higher and sustained inflation even after multiple central bank rate hikes will likely play a role in this confidence crisis.
But for now, it is still about the king US dollar. With issues in Asia and in Europe, capital flows will fun into the safety of the safe haven/reserve currency that is the US dollar. With gold and silver having an inverse correlation with the US dollar, a stronger dollar means more pain.
When it comes to gold, I put out an article on September 30th 2022 titled, “Let’s not get excited just yet gold bulls“. In that article, I mentioned the major breakdown on the weekly chart of gold. And as per technical analysis, breakdowns see price pop up for a retest before continuing lower.
Something like this:
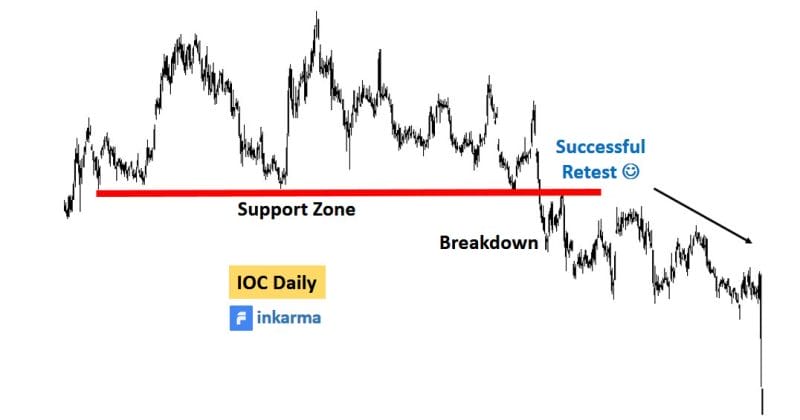
It appears like gold is showing a successful retest on the weekly chart:
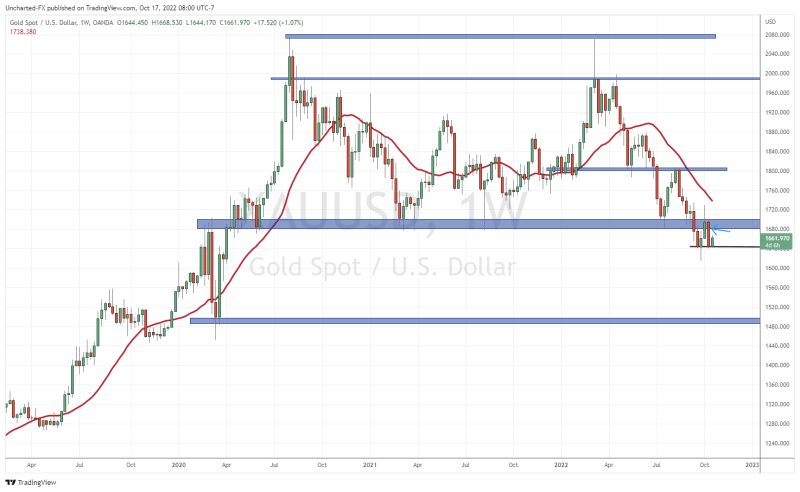
Last week’s red candle is pointed out with my blue arrow. Note that we had two green weeks after the breakdown which made up the retest phase. Two weeks ago, we actually even pushed above the $1700 zone and it looked like gold was in for a reversal. It sure did on the daily chart and smaller time frames. But this is why the larger time frames warrant your full attention. The real trend is in play on the longer timeframes.
Two weeks of green candles were all given back with last week’s candle. We did not manage a weekly close above our resistance zone which therefore meant that the downtrend was still intact and a reversal or fakeout failed. More lows are likely to come.
The good news? (For now!) Gold did not close below the recent weekly candle lows of $1640.27. We closed just above. A further breakdown, or lower low, on the weekly chart is required to confirm the continuation lower.
Remember, our target is the $1500 level. The journey to $1500 began with the breakdown below $1680, and the next step is to take out recent weekly candle close lows. A battle between the bulls and the bears will take place in this zone between $1700 and $1640.
But what if I am wrong? Technically, if gold manages to close above $1700 on the weekly chart, the downtrend will be reversed and we will go long looking for a recovery. But we can also get signs from the US dollar chart.
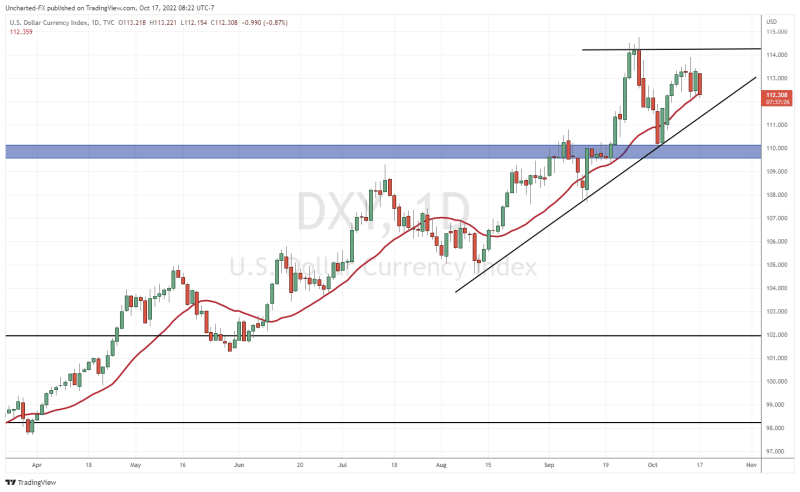
The US dollar (DXY) uptrend is still intact. The dollar has been on a massive run. Notice that when the US dollar fell between September 28th- October 4th 2022, the price of gold popped and gave hints of a reversal. Not surprising as gold and the dollar are inversely correlated. This means that gold can get sustained momentum if the dollar actually breaks its current uptrend.
For this to happen, I would first like to see the uptrend line I have drawn be taken out. But the major area that needs to be taken out is 110. Still a long way to go. Alternatively, if the US dollar closes above 114.25, then prepare for new gold lows in 2022. Not to mention the continued cratering of the Euro, British Pound, Japanese Yen and all other fiat US-Dollar paired currencies.
Very quickly for silver fans:
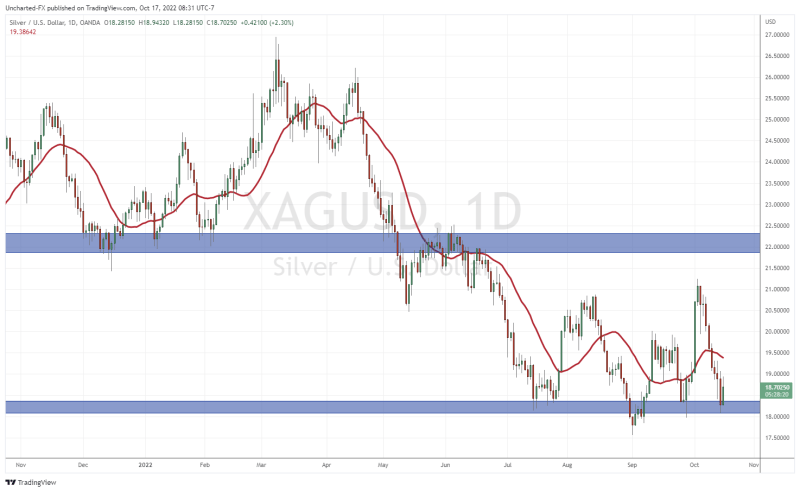
We are at the major $18 support zone. A break here sees us go down to $15 as earlier predicted. Further in depth analysis on the silver price will come out shortly on Market Moment.