
Since hitting lows at $1614.92, the price of gold has bounced over 3% and is currently resting at $1673.
Many gold bulls are saying the bottom is in. From a technical perspective, I would advise some caution just for now. Admittedly, it appears that risk is dissipating and we will be getting a bounce on most assets. US stock markets are grinding at major support and still holding above. It provides evidence that selling pressure is exhausting and we have a wall of buyers at this area. Even risk on asset Bitcoin is doing the same.
So is there a chance of a potential relief and bounce? Yes. However there are two charts which I am keeping a close eye on. We shall take a look at these charts below, but first, let’s look at gold.
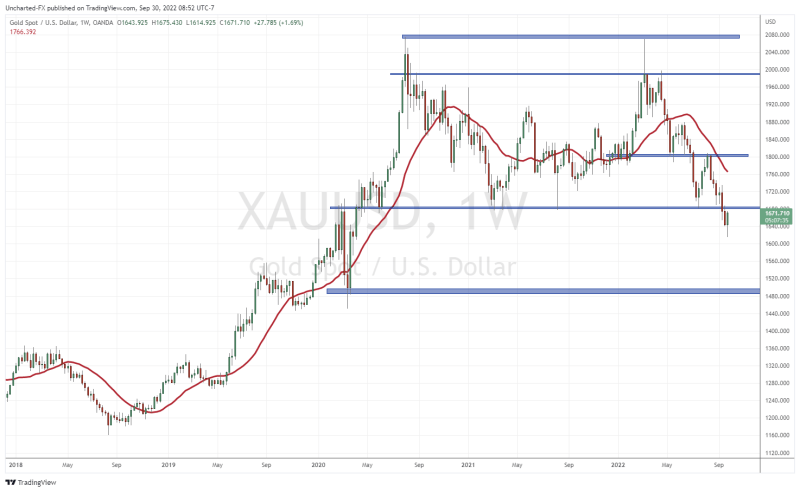
It is always good to start out with the bigger picture. Above is the weekly chart of gold. Readers will recall that I called the breakdown a few weeks ago. I warned that there is more potential pain for gold ahead. Something I am standing by for now.
What is of importance is the technical level of $1680. This zone is now acting as resistance (price ceiling). It was once support (price floor) for gold which has held up since 2020. But alas, we finally broke below it and triggered a breakdown.
As long as gold remains below this zone, more lows are coming. When we see a breakdown on the chart, we don’t see the asset move down in a straight line. There are pullbacks and relief rallys followed by sell offs. Breakdowns and breakouts tend to see the price pullback to retest their respective resistance or support before dropping down further.
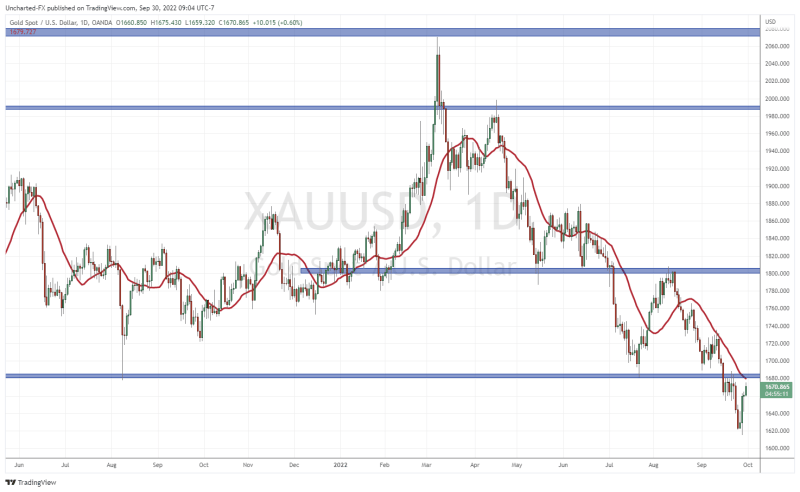
This means that this recent move is just setting up a retest at our major $1680 zone. I expect to see sellers here, and we will have to wait until the candle closes to determine whether buyers will have enough ammunition to beat the bears and force a strong close back above the $1680 zone.
Even though I am expecting more downside to follow, there are two charts to watch. A reversal in these charts would strengthen the case for gold bulls.
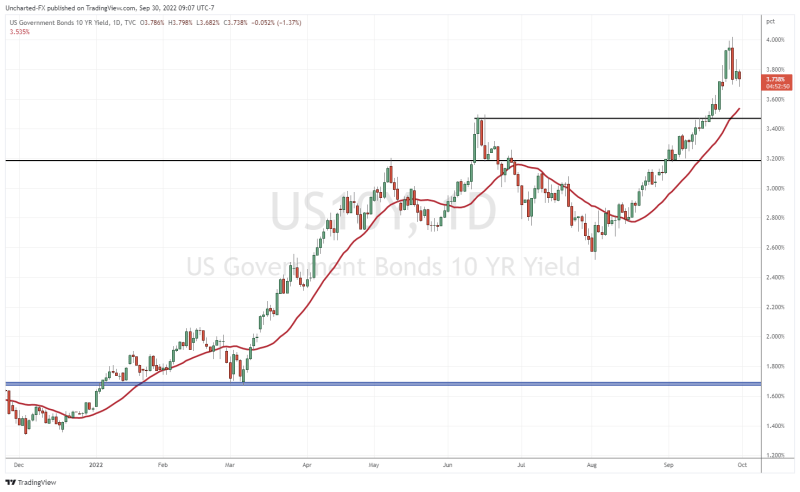
The first chart is the US 10 year yield. A major breakout occurred when we took out 3.50%. Rising yields globally has put pressure on equity markets… and are likely to continue higher as central banks raise interest rates.
This means that the drop we are seeing is likely just a pause and a relief rally. I can see a pullback in yields which will give temporary relief to markets and gold. If we can close back below 3.50%, then the probability of gold reclaiming $1680 is high.
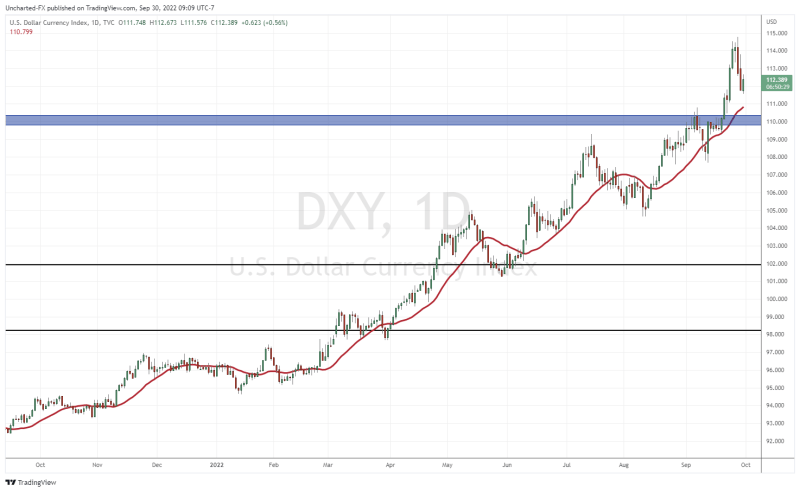
Gold is seen as the anti dollar, so it makes sense to watch the US dollar here. Major uptrend. The Dollar is strong.
DXY recently took out 110 which was a major resistance zone. The dollar then hit levels above 114 before pausing and ranging. A potential pullback is in play which could see the dollar head back to 110. If we can close below 110, then I really do get excited for gold. It would mean gold reclaims $1680 and likely continues its momentum higher.
But we need to see that 110 close first. Unfortunately for gold bulls, all I see is a pullback in a major dollar uptrend for now.
The next few days will be important for gold as it retests $1680. Watch price action here as it will determine whether we are continuing the downtrend, or if a fakeout and reversal is in the cards.