Remember those meme stocks? In recent days, GameStop (GME), AMC and Bed Bath & Beyond (BBBY) have surged as meme stock mania makes its return.
The WallStreetBets crowd is back! Or should I say the ‘apes’ are back:

All three stocks were up big last week and extended their gains on Monday.
AMC was up 16% and has now spiked 70% in just the past five trading days while Bed Bath & Beyond shot up 40% Monday and has more than doubled in the past week. GameStop rose 12% Monday and has gained 30% in the last five day.
Is there any good news? Not really. Although if you are into memes, you might love what AMC just did. The world’s largest theater chain announced a new class of preferred equity. WallStreetBets is embracing it with extended open arms. The preferred shares will begin trading on August 22nd, and this is the real selling point: preferred shares will trade under the ticker “APE” on the New York Stock Exchange.
Reaction from the meme crowd?
“We officially pounced,” one participant posted on Reddit. “Words can’t express my happiness right now.” Said another: “I just bought ten more shares today.”
How does AMC benefit from this? Well they are capitalizing on an army of retail investors who love their stock, and the APE shares will raise money for AMC. This could help AMC pay down some of its $10 billion in debt and lease obligations and also buy other theater chains.
Even as short sellers continue to pile in on these stocks, the apes could have the upper hand. The retail crowd is coming back and buying the meme stocks, at a time when Wall Street and major funds have been cautious.
Will there be enough ammo from WallStreetBets to cause another short squeeze and see triple digit yearly gains on AMC, GME and BBBY? That’s the big question.
A positive is that if these meme stocks continue to make headlines, the retail crowd which has mainly disappeared, will return to markets. Trust me, I know many friends with high paying IT jobs who used to call me everyday about the stock markets. I haven’t heard from them in many months. When this money returns, it will spread to other big tech names which have been beaten up and are much cheaper today than they were when this class of retail crowd initially chased them.
The downside possibility? US CPI comes in higher and Wall Street increases the likelihood of a large rate hike in September and beyond. Instead of the Fed pivoting due to an economic slowdown, Jerome Powell says the labor market shows no signs of an economic slowdown and the Fed remains hawkish.
Let’s take a look at the charts of the meme stocks.
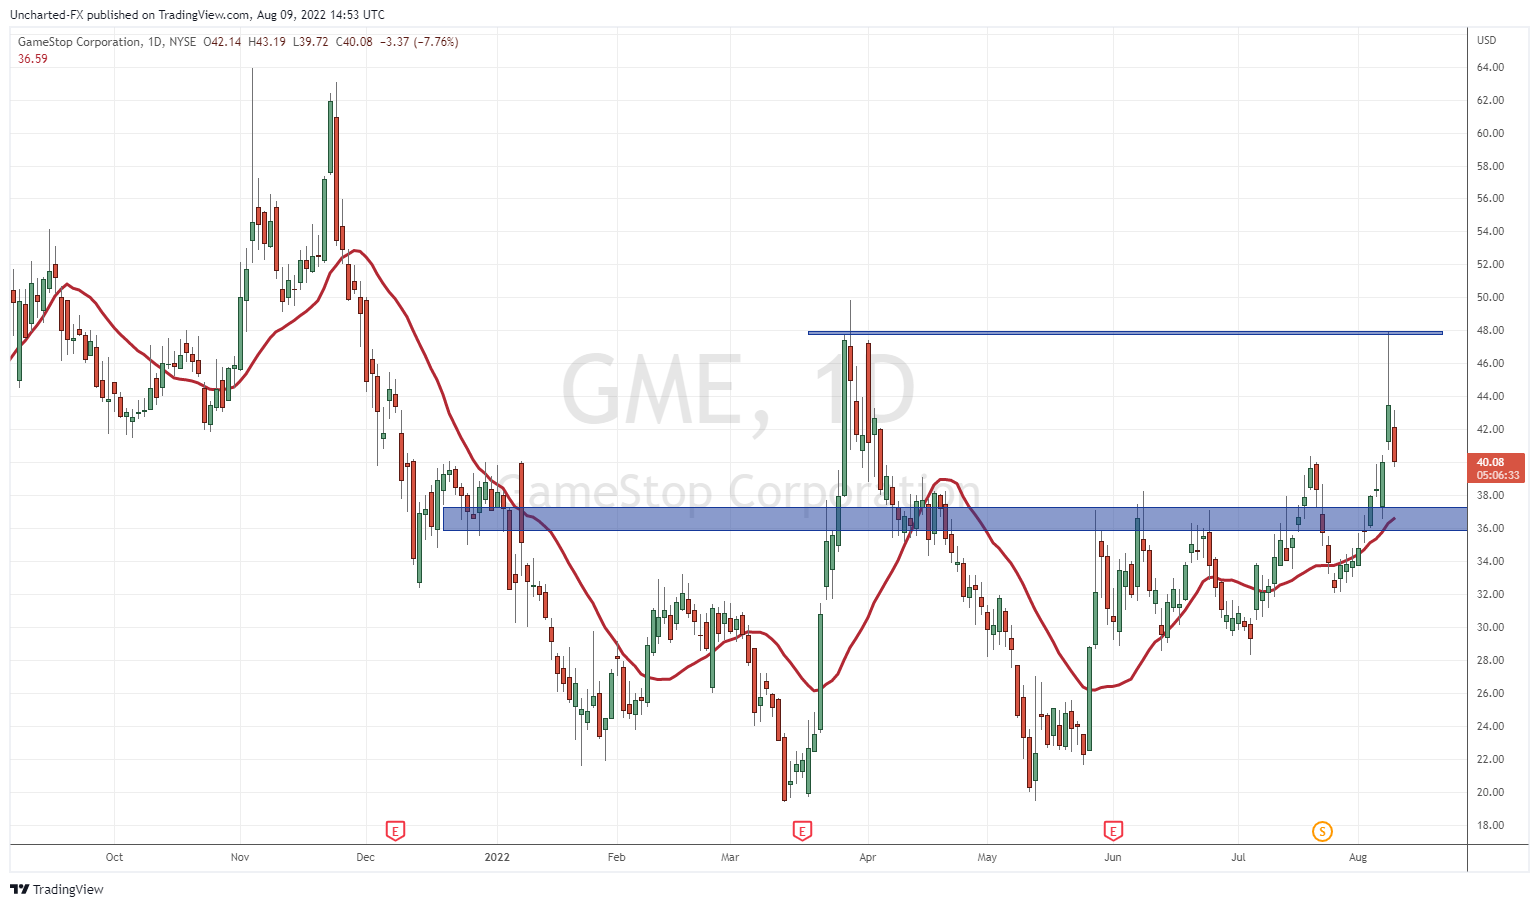
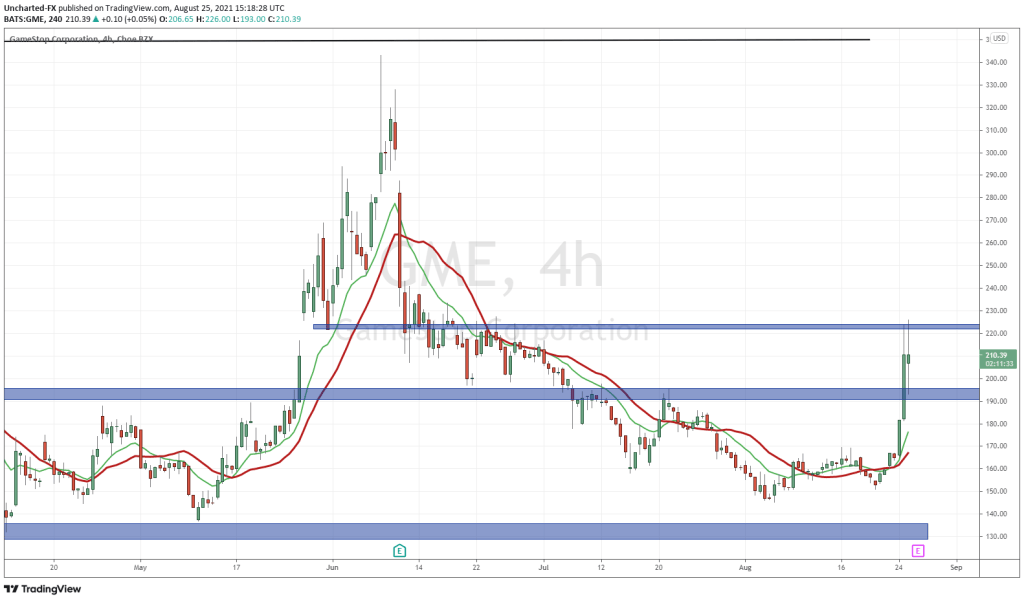
After 9 green days in a row, GME is pulling back. Some will say this is the capitulation. I wait for technical levels to break before I can say that. The breakout above $36 was important and bullish for the stock. This break took us to our resistance zone at $48 on the following day. $48 remains the major resistance ahead. For you apes out there, you want to see a close above $48 to continue the rally to the moon.
Alternatively, if GME closes back below $36, we can say that this meme stock momentum is over for now. We would lose breakout momentum, and the stock would likely just range as it did before this current pop.

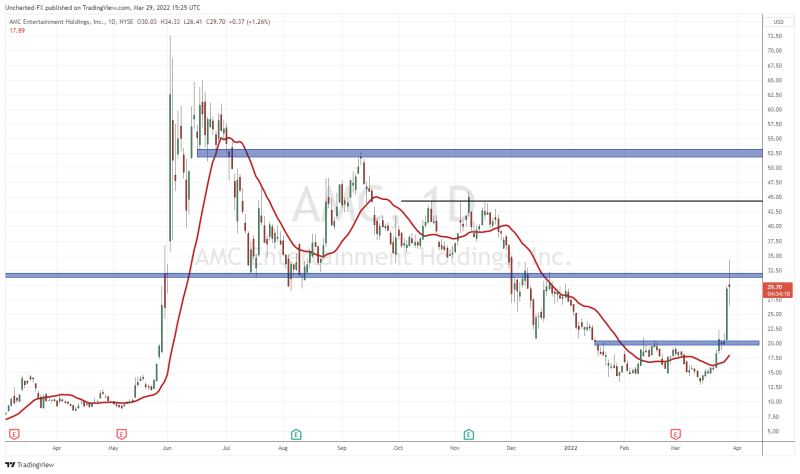
The next two charts actually look appealing to a technical trader like myself. AMC had a very nice basing, and some can argue we triggered an ugly looking cup and handle reversal pattern. $16 is the major zone that must hold for more upside momentum. If we dip that low, it would be a great area for the apes to buy.
To the upside, we have a major resistance and flip zone (just a fancy way to say an area which has been both support and resistance) at $30. Just with GME, AMC apes want to see a close above $30 for a rally to the moon. From a technical perspective, this chart actually looks decent with that basing and breakout. Now it is all about attracting new buyers and sustaining momentum. The big catalyst could be the preferred ‘APE’ shares.

Alright, we have something really nice here. The reversal pattern that we triggered with a break above $6.00 is the type of technical pattern I would trade on any stock. After a long downtrend, the stock began to range, which is a sign of selling exhaustion and bottoming. The breakout of the range is the trigger, and break we did with strong volume and a large green candle on August 5th.
The rally extended to resistance at $13 which is the hurdle preventing a continued rally. The stock is now pulling back, but we should note there is a large gap between $8.20-$10.80. Gaps are supportive and indicates strong bullish pressure. If BBBY closes back below $8.20, it will have filled the gap which isn’t a strong sign for continuation. If this happens, I would not be surprised to see a close back below $6.00.
The apes are back, but for how long? Will other fundamental data concerning inflation and the Fed be enough to pull the rug? Or is the ape army back reloaded with more buying ammo?
Happy trading.

