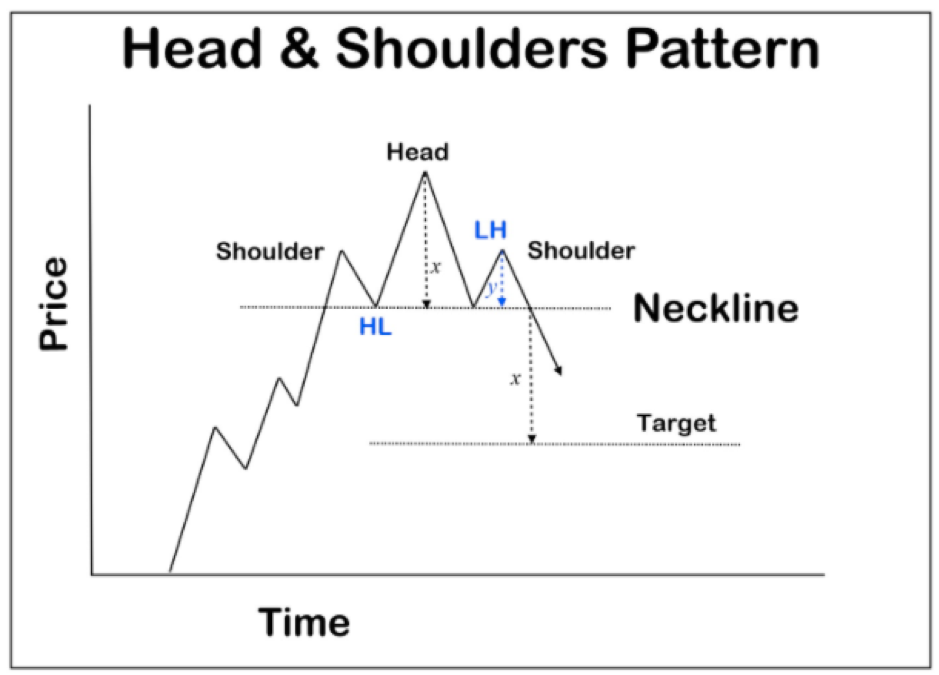
Prepare for a big week folks. Last week, I discussed that the US Stock Markets are hinting at printing the quintessential reversal pattern on the weekly chart. I am talking about the head and shoulders pattern. What makes this important, is the fact that the stock markets have not printed a proper head and shoulders pattern since 2007. And we all know what happened then.
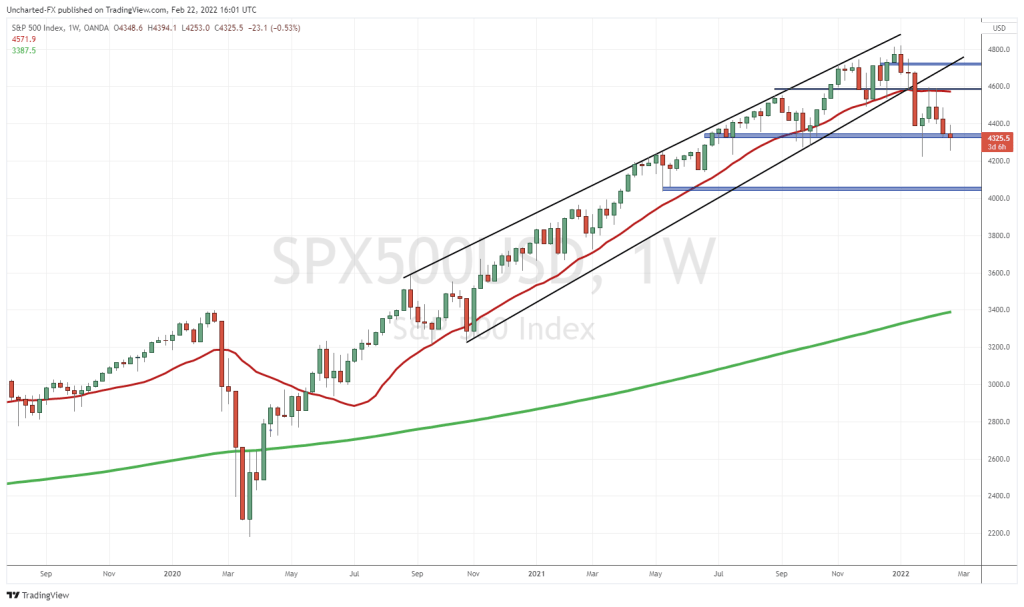
Currently, prices are testing that neckline of the head and shoulders pattern. But we will not get the confirmation until Friday close since we are discussing the weekly time frame.

First, let’s talk about fundamentals. You know, it might be difficult to remember that the Federal Reserve, Interest Rates, and Inflation are the driving factors weighing in on markets. This is because the geopolitical issue has taken center stage. Russia and Ukraine is all you hear about, and President Biden last week on Friday (who was over 1 hour late for his conference because he waited for stock market futures to close) said he believes Russia is going to invade Ukraine. Since then, we have seen the Donbass region become a separatist region which Russia has acknowledged, and troops have moved in for peacekeeping duties.
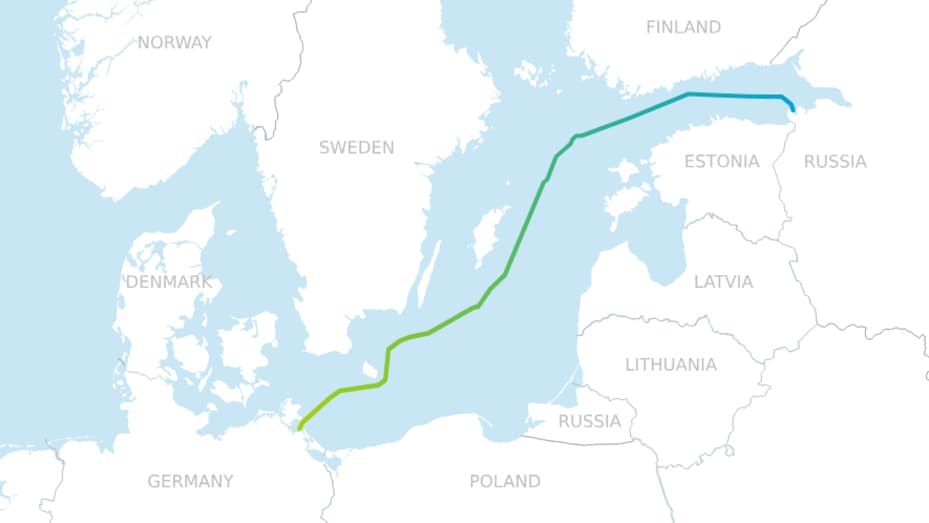
Big round of sanctions from the US. Britain and other parts of Europe are following with sanctions as well. I think the biggest surprise for me is that Germany is halting the approval of the Nord Stream 2 gas pipeline which delivers Russian gas to Europe.

Russian gas is cheap, but technically, European nations can import liquified natural gas from the US. The only issue is it is a lot more expensive due to transportation. Maybe not the best idea when governments are spending a lot of money, and of course, will see European consumers spend more on their energy bills. I think this is important so let’s keep an eye on this. Most geopolitical strategists believe the ace card President Putin holds is that Europe depends on Russian gas…especially during winter.
What went under the radar is that China could be entering the fray. China also imposed sanctions on US companies Lockheed Martin and Raytheon due to an arms sale to Taiwan. China has been quiet because of the Olympics, but now that they are over, China might have something to say here. Generally, the Chinese back Russia at the UN Security Council. President Putin was one of the (if not the only) world leader that went to China for the Olympics. The alliance between Russia and China is one that worries US strategists, as both nations likely have motivation to end US hegemony and head to a multipolar world.
As I said earlier, let’s not forget the Fed is up in mid March. Rate hikes, and more specifically, the amount of rate hikes, will really be what weighs in on markets. But of course a geopolitical black swan event would also cause a major sell off.

Oil is up over 1.9% at time of writing, but still is ranging at our resistance zone. I was expecting Oil to pop more. Perhaps this is the sign that the markets are not too worried about the geopolitical issue.

The 10 year yield has pulled back to retest the previous breakout zone. Bids are coming in. Remember, when bond yields move up, it means bonds are selling off. A positive sign for markets because it means money is moving out of risk off assets, and likely heading to stock markets. However, higher rates can put pressure on stock markets as it means multiple rate hikes are coming. As always, keep an eye on this chart.

Before we look at US markets, I want to talk about the European markets. Both European and Asian Stock Markets were open yesterday. A few European markets sold off hard. The German Dax is the big one. In fact, you can say it triggered a head and shoulders pattern on the daily chart. A big recovery so far today, but we still will be retesting the breakdown zone at 15,000. If we can close above, then the breakdown has been neutralized. But until then, we can expect another lower high move in a new downtrend.
Now, to the US Stock Markets. When I said that the markets might see a crash just like 2007, I was not joking. We even have fundamentals that we can point to.

We could not take out 4600 last week, meaning that a right shoulder is entirely possible. It sure looks like it now.
We are pretty much exactly at the neckline support, and since we are waiting for a weekly candle close, we have all week until the end of Friday to determine whether we hold above, or breakdown and initiate a new downtrend.
When I saw this head and shoulders structure a few weeks ago, I was already thinking “uh oh, something might be happening”. In an age with imperfection information, charts can show us what money flow is doing, and can even predict events. With this head and shoulders pattern, I am a bit worried that the geopolitical situation could take a turn for the worse.
If we do not close below the neckline, then the head and shoulders pattern is not triggered. It means we can continue the uptrend into new record highs. The key level for me still remains that 4600 level. If we can take that out, that would be a positive sign that we are not going to print a head and shoulders pattern here.
Make or break week, and potentially weeks, here for US Stock Markets and world equity markets.

