

As Russia-Ukraine fears subside, the Stock Markets are getting a nice bid, and risk assets like the VIX and precious metals are dropping. All positive signs for the Stock Market BUT let’s not forget other themes such as inflation and Federal Reserve rate hikes.
Even though Stock Markets are rising today, I am going to present a technical case that a 2007 Stock Market Crash could be coming. And maybe it begins this year.
One can totally see how this happens. Sure, the geopolitical risk and a black swan event is still on the table. But I think most people will point to the Fed. Here is how it could play out:
The Federal Reserve begins to raise interest rates. The cheap money stops. Or let’s entertain another possibility. The Fed raises rates, but this causes a recession in itself. Compounded by consumers saving money and not spending as much due to inflation, which continues higher because 25 rate hikes won’t cut it. Whatever the case, raising rates could cause a financial crisis due to the amount of debt out there. Maybe hit pension funds or something. A financial crisis would be required in order to compare back to 2007.
So this is why I bring this up. Let’s take a look at the WEEKLY chart of the S&P 500. Remember, each candle represents price action for 1 full week of trading.

Some of you with technical astute eyes see what I am seeing. A potential reversal pattern called the head and shoulders pattern could be developing. I say developing, because a key area has to be taken out for confirmation. If this isn’t taken out, then all of this price action could still be a higher low in an uptrend, and we continue printing new record highs.
So what is this key zone? It is the support, or neckline in a head and shoulders pattern, at the 4300 zone.
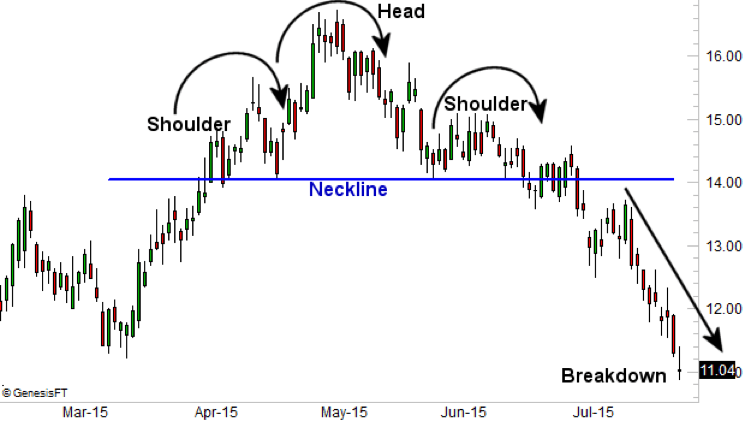
For those new to the pattern, this is how the structure looks like. Comparing it to the S&P 500 chart, and all we are missing is the right shoulder and the neckline breakout.
You will see this pattern many times in your trading career. Heck, I have made a career out of trading this pattern. One mistake I see people make is that they trade head and shoulders reversal patterns when it appears in a range. This is incorrect. A head and shoulders pattern is a REVERSAL pattern. Meaning we need it to develop at the top of an uptrend. The key component is that this pattern prints when there are MULTIPLE higher lows and higher highs, or simply put it, an uptrend has been ongoing for a long time.
This criteria is certainly met on the current chart of the S&P 500.
Here is where things get interesting. The last time the S&P 500 had a head and shoulders pattern on the weekly chart which met our criteria? Yup you guessed it. Back in 2007 and what followed was the great financial crisis (GFC).

Above is the weekly chart of the S&P 500 in 2007, and the price action which followed. Interestingly enough, we also got a weekly head and shoulders pattern back in 2000, but the pattern isn’t as clean as the one printed in 2007, and the one we could be printing right now in 2022.
The structure is there. A long uptrend, and when I mean long I am talking about higher lows and higher highs persisting for FOUR years. And then the reversal pattern after a long uptrend. And then the fall which of course saw the Fed take rates to 0% and initiate what became to be known as Quantitative Easing…although Richard Werner in his book, “Princes of the Yen” coined the term decades ago as it was essentially what the Bank of Japan did too.
So just some food for thought given everything that is happening. As of now, the 4300 zone has to be taken out to even begin to entertain a reversal pattern. I would be watching the 4580 zone as this is the top portion of the right shoulder. If we were to close above this level, then the right shoulder is pretty much off the table, and we continue to make higher lows and higher highs.