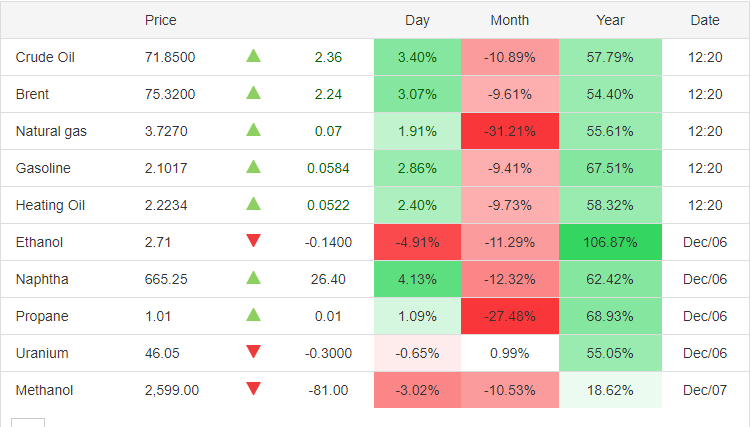
We just had an everything sell off. Omicron fears or the Fed doubling their taper, take your pick, weighed in on equity markets. It seems fear has subsided and the dips are being bought. A good bump in crypto’s, stocks, and oil. Precious metals are still lagging, but they look ready to join the party. Another commodity that has been hot in recent months has been Uranium. I was interested to see how Uranium acted during this everything sell off. It didn’t do much, but mind you, it is a commodity that isn’t traded as much as others.

While the major energy commodity complex took a hit this month, Uranium managed to hang onto positive territory. Not too shabby.
The fundamental case remains supply and demand constraints, especially if the demand for Uranium increases if humanity goes towards nuclear energy. Bill Gates has even said that nuclear energy is how humans can combat the climate crisis. I mean nuclear energy is CO2 free. He is putting his money where his mouth is as Gates has cofounded TerraPower, who are building the next generation nuclear power plants. I think the next generation part is important. When most think of nuclear energy, they think Fukushima. What many don’t know is that plant was an old one. People actually ran to the modern Fukushima nuclear plant for safety. Modern and next gen power plants are some of the safest buildings on the planet. This needs to be mentioned because I think there is still a hesitancy and fear by the majority to accept nuclear energy due to safety concerns.

Nations are beginning to shift to nuclear power. I have my eyes on China, who will want to replace Coal for something much cleaner and has no CO2 pollution. Nuclear energy is the CCP’s choice. This going green trend will only get stronger heading forward. There is even geopolitics attached, not only due to a few big nations not signing up to the Paris Climate Agreement, but Russia’s role in this all. If you have read Marin Katusa’s “The Colder War” book, he details how the Russians dominate Uranium supply (along with their Kazakh allies) as well as enrichment capabilities. Basically countries will rely on Russia for the Uranium and then the enrichment technology. If you are going nuclear, the Russians will be involved in some capacity. With Uranium being a strategic reserve in the US now, we are bound to see moves in the North American Uranium space. Supplies will be required, which means a great environment for Uranium explorers with good assets.

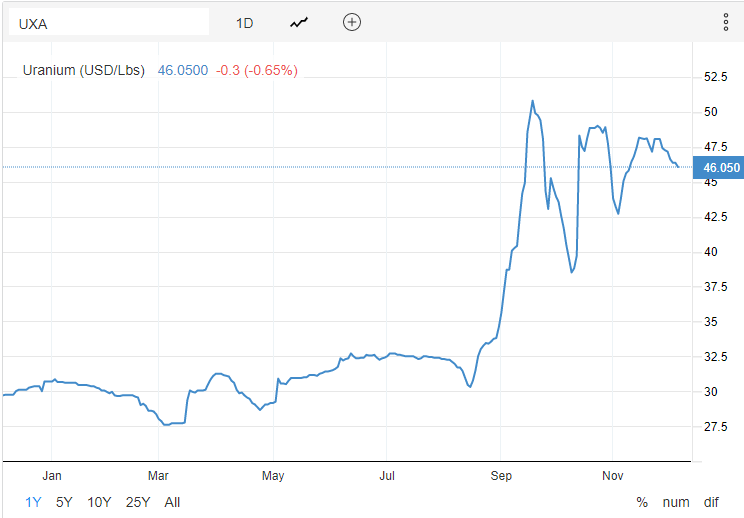
In terms of current Uranium prices, we sit at $46.05. We have tried to eclipse recent highs slightly above $50, but to no avail. However, we are still forming higher lows. What we have here is a triangle pattern. If you draw a trendline connecting the highs, and then a separate trendline connecting the lows (higher lows), we have a triangle that price is consolidating within. A breakout is needed.

One can also use Sprott’s Physical Uranium Trust as a proxy for Uranium prices. This trust follows the spot price of Uranium, and the triangle set up I am referring to can be drawn and seen on my Sprott chart above.

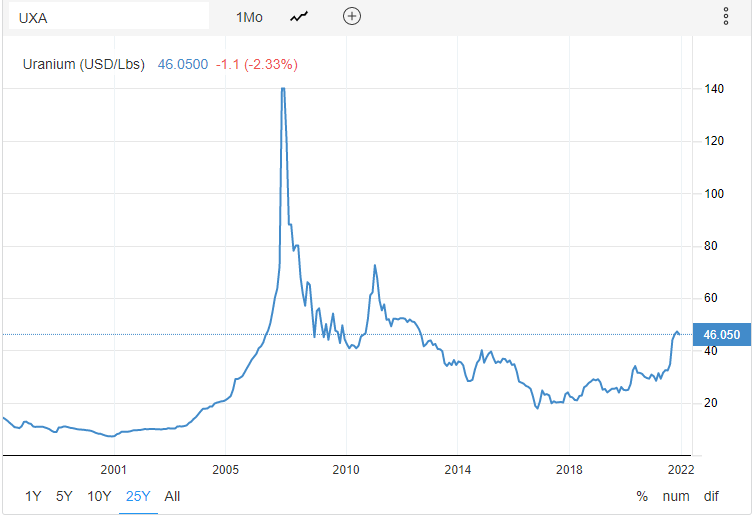
If we look at Spot Uranium on the monthly timeframe going back 25 years, our major support still comes in at $40. Meaning Uranium prices remain bullish and in an uptrend as long as $40 is held going forward. If this triangle pattern breaks, a move back to $40 is not out of the question, and a real test to see if buyers and bulls hold will occur there.
What this means is for us Uranium bulls, there will be an opportunity to enter Uranium stocks at good prices.

I want to start our technical rundown with the big boys, Cameco. If you want a Uranium producer in your portfolio, this is the company you want. Cameco hit highs of $35.47 this year before pulling back. I have the weekly chart pictured above. We are now retesting a major support zone. Support that used to be resistance, which held since 2014. I am talking about the $26 zone. This week, Cameco pulled back to retest $26, and look what happened. Buyers are stepping in. A weekly close above $30 would be very bullish.
Before we delve into a few company charts, it should be noted that the drops are from tax loss season. Which provides us with great entry opportunities going forward. Some of these prices are great, but we could be selling off more until the end of the month. January would be a prudent time to allocate more funds from initial pick ups here.
Skyharbour Resources (SYH.V)
Skyharbour Resources Ltd., a uranium and thorium exploration company, engages in the acquisition, exploration, and evaluation of mineral properties in Saskatchewan, Canada. Its flagship project is the Moore Lake Uranium project covering 35,705 hectare, located on the eastern portion of the Athabasca Basin.
Skyharbour is a company that has been recently featured as an idea for the day. You can read all about them in Lukas Kane’s latest Uranium Sector round up here.

In my most recent technical coverage of Skyharbour’s chart, I highlighted this weekly candle chart. The breakout above $0.63 was huge. Just like Uranium markets, we were taking out highs not seen since 2014. Unfortunately, the retest did not hold. We closed back below.

The daily chart isn’t looking too shabby. We now closed below $0.50 which is an important psychological zone for stocks under $1.00. I am now looking at prices around $0.375 for some support. Again, tax loss season is the culprit, and the stock may drift a bit lower before catching a bid. Still one of our favorite pure Uranium plays for the next leg up.
Fission 3.0 Corp (FUU.V)
Fission 3.0 Corp. engages in the acquisition, exploration, and development of uranium resource properties in Canada. It holds a portfolio of 14 projects located in the Athabasca Basin.
Fission is a project generator and a property bank, so a bit different than the others. They work on multiple properties in order to identify highly prospective projects and either de-risk them for a potential sale. The company just announced a $5 million brokered private placement yesterday.

Now this is a chart that looks a bit better technically. I am liking what I am seeing here on the weekly charts. Fission is still technically in an uptrend as long as $0.15 is held going forward. Really like what I am seeing on the bid this week, which could be another higher low in this uptrend which would be confirmed with a close above $0.30. We know they will be getting the cash to advance projects and create catalysts for shareholders.
CanAlaska Uranium (CVV.V)
CanAlaska Uranium Ltd., an exploration stage company, engages in the acquisition and exploration of mineral properties. The company primarily explores for uranium, nickel, copper, gold, and diamond deposits. It holds interest in the Geikie project that comprises six new uranium targets totaling 33,897 hectares located in the Eastern Athabasca basin. The company also holds interests in approximately 214,000 hectares of mining claims in the Athabasca basin located across the provinces of Saskatchewan, Manitoba, British Columbia, and Alberta in Canada. Another project generator company with an extensive land holding over in the Athabasca region.

CanAlaska technically is a stock that one can act on in a short period of time. Why? Well first we are at a major psychological support zone of $0.50. Secondly, is how this support lines up with an important support zone on the longer weekly chart. We took out levels not seen since 2017, and we have pulled back to test this zone. In summer, we actually tested this support before, and we bounced from here. A weekly close above $0.75 on this gets us new recent higher highs.
Another stock that has fallen due to tax loss season. Buying at this support is what we want to see!


