The fear trade is back. Travel restrictions are back. Possible lockdowns can come next. Or at least, that’s what the Market is pricing in. A new Covid variant has emerged from South Africa. B.1.1.529 has been detected in small numbers in South Africa, and has now made its way to Israel and Hong Kong. It is a ‘dramatically’ new Covid strain with ‘extremely high number’ of mutations.
South African scientist Tulio de Oliveira said in a media briefing held by the South Africa Department of Health on Thursday that the variant contains a “unique constellation” of more than 30 mutations to the spike protein, the component of the virus that binds to cells. This is significantly more than those of the delta variant.
Many of these mutations are linked to increased antibody resistance, which may affect how the virus behaves with regard to vaccines, treatments and transmissibility, health officials have said.
Stock Markets are feeling it. The one glimmer of hope: liquidity COULD be low. Yesterday was Thanksgiving in the US, US markets were closed. Some people on Wall Street tend to take the day after Thanksgiving off too. So I will be interested to see how assets move come Monday. Also, today is a shortened trading day.
A market pullback was expected and I was hoping for a drop in November setting us up for a Santa Claus rally. I think it is more possible now because it is likely the Fed pushes down rate hikes WAY down the road, and un-tapers their taper. These monetary policies were not in place when the world shut down the first time and markets got crushed in 2020. The brrrr will continue.
Airline stocks and travel stocks are gapping down. Oil is down 10%, its worst day of 2021, as the world fears another global lockdown. That’s saying something. The lockdown stocks such as Zoom Video, Campbell’s Soup and Clorox are doing well…more on those charts next week.
I have a lot of charts to go over today, so here we go!

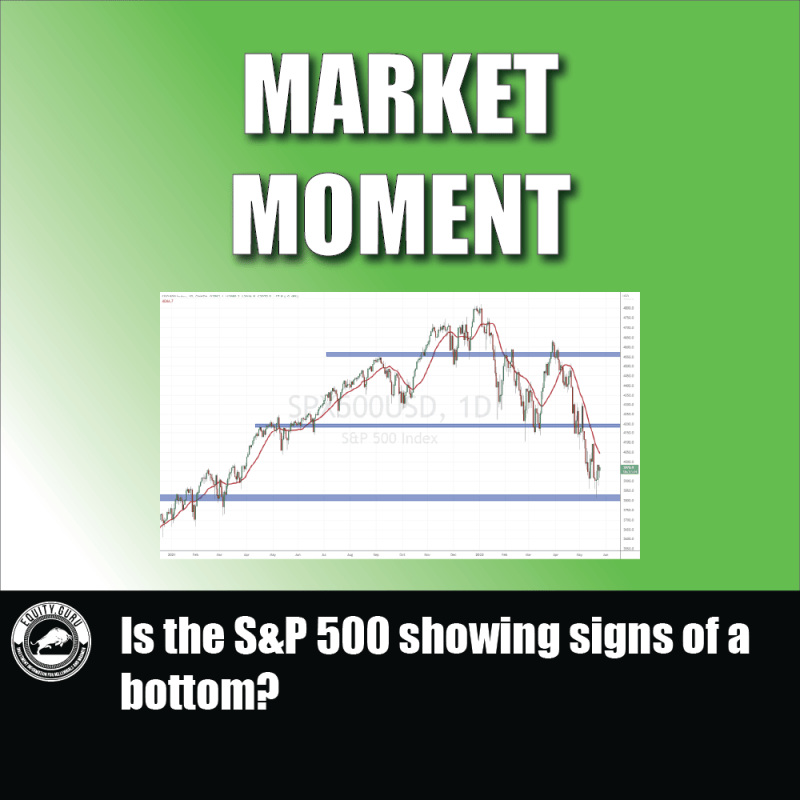
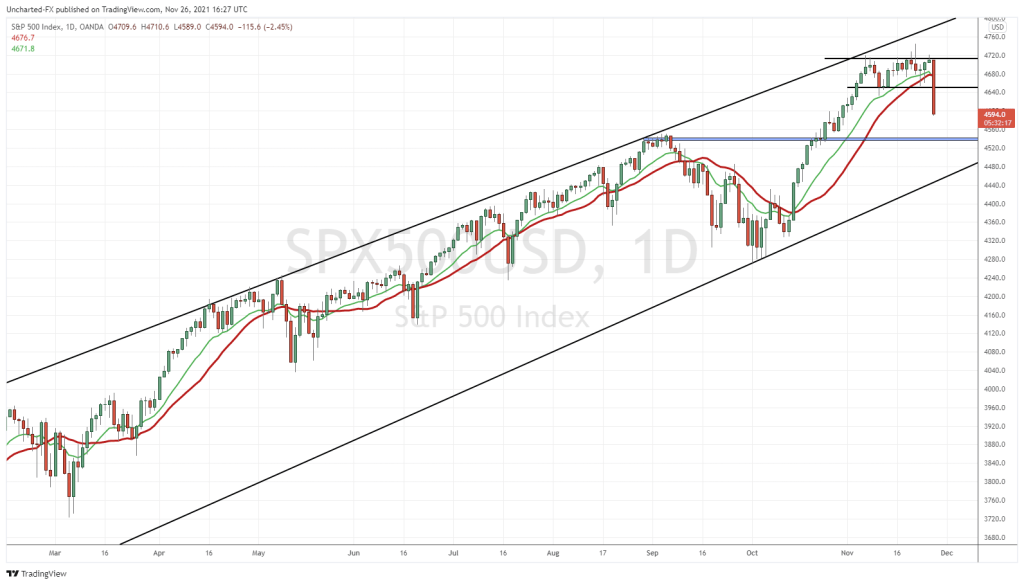
Let’s start with the S&P 500. For the past three weeks, we have just been ranging. It hasn’t been fun. Until today. A huge move down, with the S&P down 2% at time of writing. Readers know what I will be watching for. Yes, that’s right, a daily close below this 4650 support. If we closed the day just like this, then a deeper pullback to 4520 is in the cards. From there, we will have to see if the S&P holds on the retest of support. I say this because…

This week, I have been talking about the support test on both the Dow Jones and the Russell 2000. I said if the S&P 500 and the Nasdaq pullback, then it is likely the Dow and Russell fail their retests. Just like they are right now. A daily close below 35600 is bearish. We will head down to 34000. The Dow is down over 900 points at time of writing.

If you are a member of our free Discord channel, I have been talking about this VIX chart. Just been watching for some sort of fear move. Well we have it. The VIX is up nearly 50%!

Money is running into bonds. Which makes sense if we use the risk off and risk on model. Money is leaving stocks for the safety of bonds. A risk on environment turning into risk off. Things get spicy if we break above 152. It would hint at more dovish monetary policy ahead. Meaning no rate hikes, but even lower rates. Possibly even negative rates like Japan, the EU, and Switzerland to name a few.

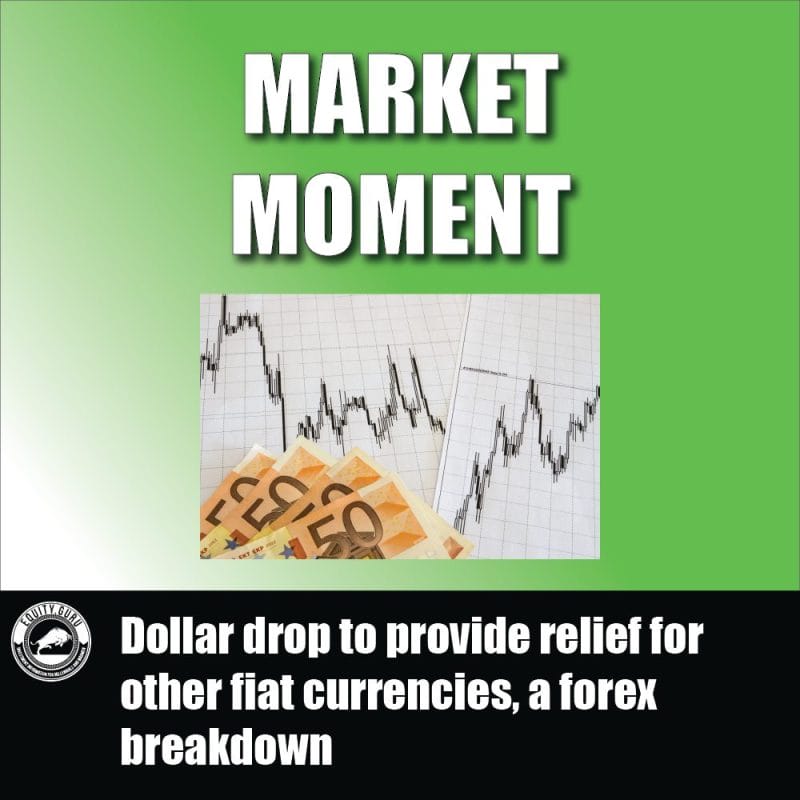
The US Dollar, or the DXY, is dropping. If this was green, then I would say we have a pure risk off move. When bonds, the VIX and the US Dollar move up together, then watch out. Things get complicated with the US Dollar because of the Federal Reserve. In a previous Market Moment article, I discussed the US Dollar could be rising because of interest rate/taper expectations. Bascially a hawkish Fed. Or, we were seeing a move into safety. With this sell off, we can confirm money is leaving the Dollar because now the market is beginning to ponder if the Fed un-tapers their taper and reverts back to being dovish.
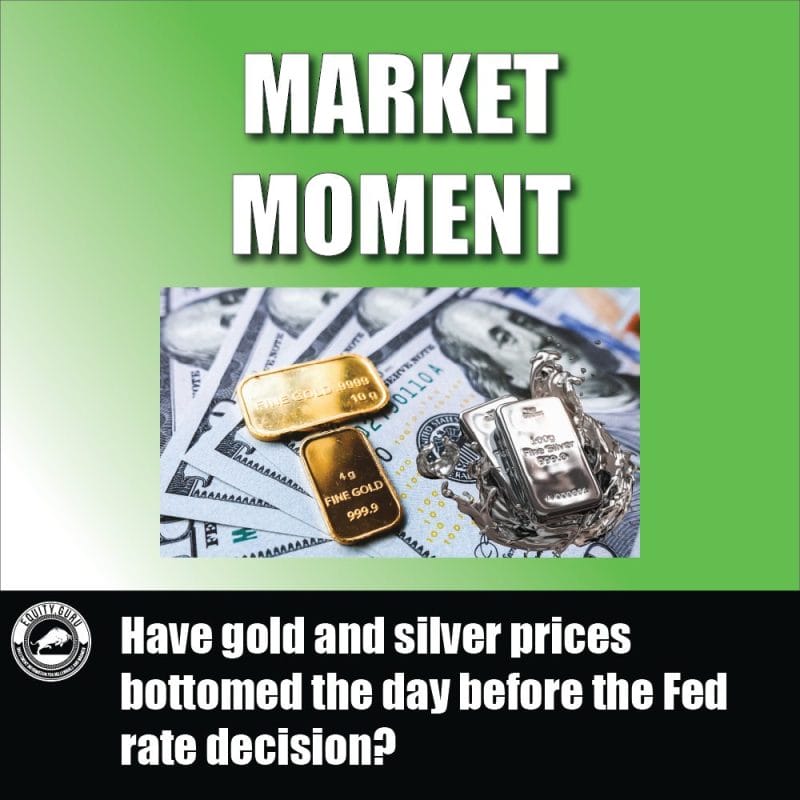
For us metal fans, Gold and Silver are heading lower even with a weak dollar. Crypto’s too. Reminiscent of the everything sell off back in 2020.
I want to leave you with one chart. Some may put this in the category of conspiracy, but for a guy who has been watching these markets since 2012, I have seen too many ‘coincidences’. The truth is technical analysis and market structure is important because big money knows things before everyone else does. You see this with the Forex markets a lot before major economic data events. If you are a member of our Discord, I spoke about the South African Rand joining in the ranks of the Turkish Lira. As the US Dollar rises, it will put pressure on emerging market currencies.

This is the chart I posted to notify our Discord members. On November 18th 2021, we had a breakout of a broad inverse head and shoulders pattern. I recommended a long. A few days later we hear about this variant. Just saying folks. Watch the charts as they give you a clear picture of money flows. EURCHF is the biggie right now. As the Euro pops on all other pairs, the EURCHF remains below 1.05 and looks like it wants parity. Wealthy Europeans are running into Swiss Bank accounts. What do you think this means for Europe? You can probably take a good guess.