Uranium is hot. A big congratulations to all my fellow Uranium Bulls who have been extremely patient, holding positions for years. I know you are out there. We have crossed paths many times at all the resource conferences here in Vancouver. The good news? Things are just getting started. Countries are building new nuclear power plants, and others like Japan are restarting nuclear plants. As we go green, there is one energy source which stands above the rest. Even billionaires like Bill Gates are bullish on nuclear energy, saying it is the way to fight climate change since it emits no CO2. Gates says the world should stop shutting down nuclear power plants and start building NEW nuclear power plants. This means demand for Uranium will have to increase. In terms of the current supply and demand mechanics, that means higher Uranium prices. Something which we are seeing right now, but more on that when I break down Uranium prices.
Uranium miners and explorers have been popping. After a huge rally, it appears as if it is time for a pullback as profits are being taken before the end of the year.
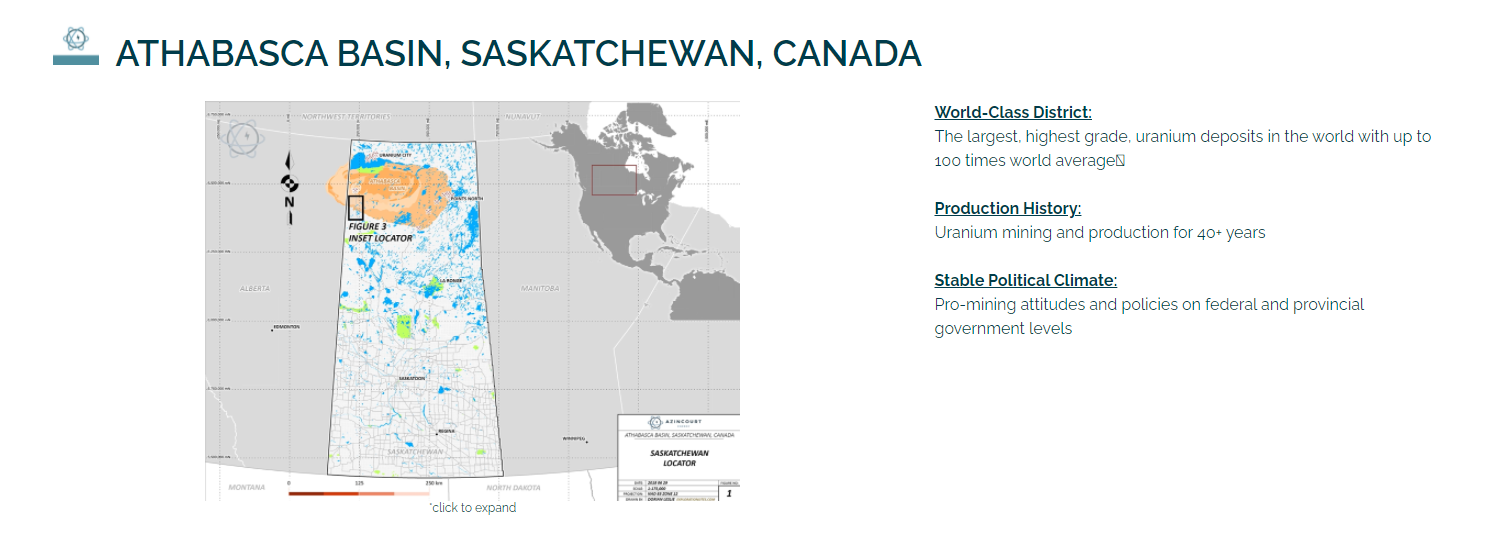
Azincourt Energy (AAZ.V) is a Canadian-based resource exploration and development company focused on the alternative fuels/alternative energy sector. The core projects are in the green energy space focusing on Uranium projects in the prolific Athabasca region. Good jurisdiction, and high grade Uranium. The place you want to be. Azincourt also holds lithium/uranium projects in Peru, on the Picotani Plateau. Currently, Azincourt is developing the East Preston uranium project, located in the prolific Athabasca Basin, with partners Skyharbour Resources (TSX.V: SYH) and Clean Commodities Corp (TSX.V: CLE) , and the Escalera Group lithium/uranium project in Peru.
Azincourt controls a majority interest (72%) in the 25,000+ hectare East Preston project as part of a joint venture agreement with Skyharbour Resources (TSX.V: SYH), and Dixie Gold. Three prospective conductive, low magnetic signature corridors have been discovered on the property. The three distinct corridors have a total strike length of over 25 km, each with multiple EM conductor trends identified. Ground prospecting and sampling work completed to date has identified outcrop, soil, biogeochemical and radon anomalies, which are key pathfinder elements for unconformity uranium deposit discovery.
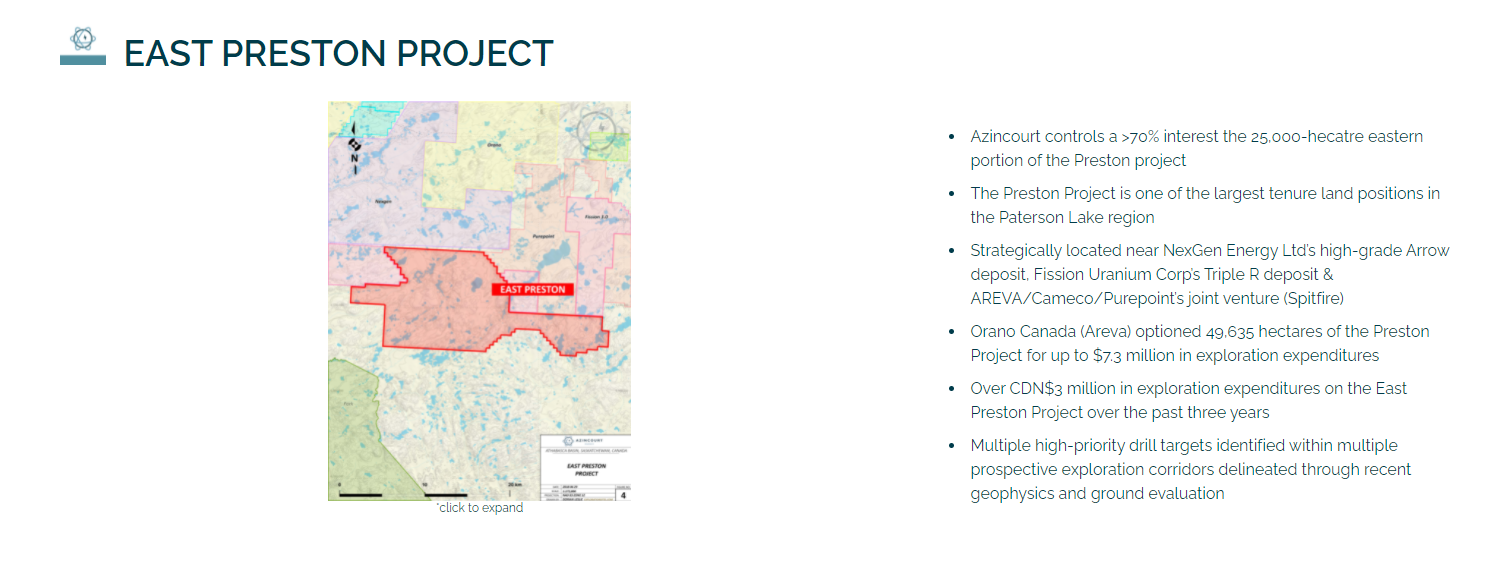
Recent news regards updates on Azincourt’s upcoming drill program at the East Preston Project. TerraLogic Exploration Inc. has been contracted to facilitate and execute a planned diamond drilling program, which will consist of a minimum of 6,000m of drilling in 30-35 drill holes. Preparations are well underway and contractors for drilling, camp services and roadwork have been selected. Opening of the 60 km winter road to access the property and campsite is expected to commence by the end of November, with camp construction in late December and into early January. Drilling is anticipated to commence in early January utilizing two diamond drill rigs to complete the program.
“We are excited to return to the property and continue drilling where our aborted 2021 program left off,” said VP, Exploration, Trevor Perkins. “This will be the largest program to date on the East Preston project. The A-G and K-Q Trends are at the point now where drilling is the best way to test our ideas, focus in on the most responsive areas, and confirm what these trends have to offer,” continued Mr. Perkins.
The current focus is Uranium and for good reason as I highlighted the supply and demand trend.
If you have been following commodities, then you know Uranium is HOT. I have highlighted the Uranium breakout in a previous Skyharbour Chart Attack post. Here is a quick update:
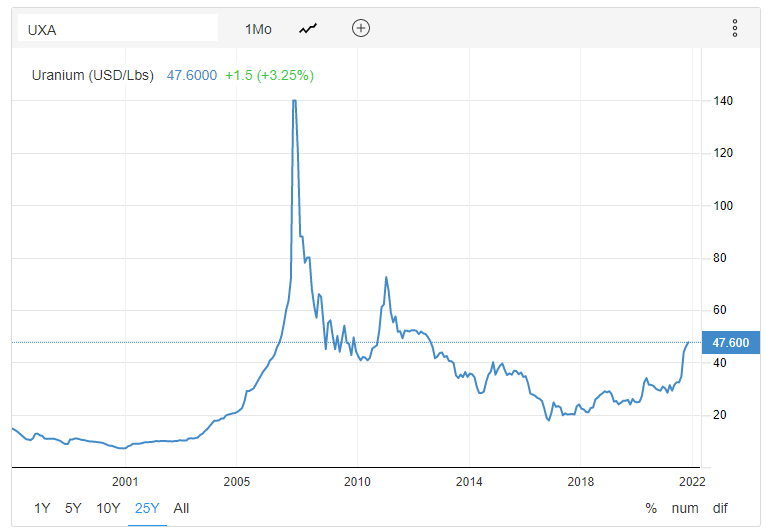
On the monthly chart, we are still in a new uptrend. The big breakout occurred at $40. What was once resistance now becomes support. There is a possibility Uranium pulls back to retest $40 before continuing higher. Again, this would be expected as typical breakout price action. I would only get a bit worried if the monthly close takes us back below $40. More upside is expected in the long term due to the move to clean energy…and maybe even a hint of the inflation trade. I believe commodities will do well if we see inflation data come out higher and market participants begin to question the Fed’s transitory inflation narrative.
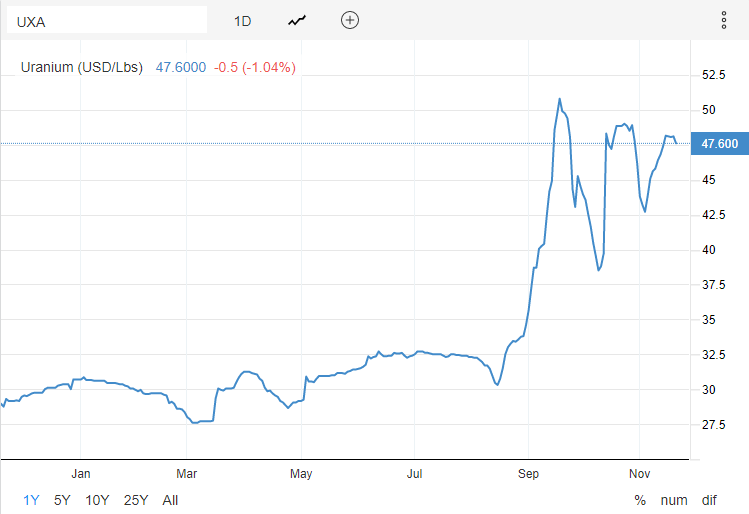
If I take Uranium down to the daily chart, you can see the levels we are bouncing between. In fact, one could draw a triangle connecting the recent lows, and the recent highs. Both of these levels provide support and resistance. We just need the breakout, hopefully to the upside, but as mentioned previously, a move lower to $40 would not be a surprise or a bearish signal. It is just something price will have to do to maintain this new uptrend.
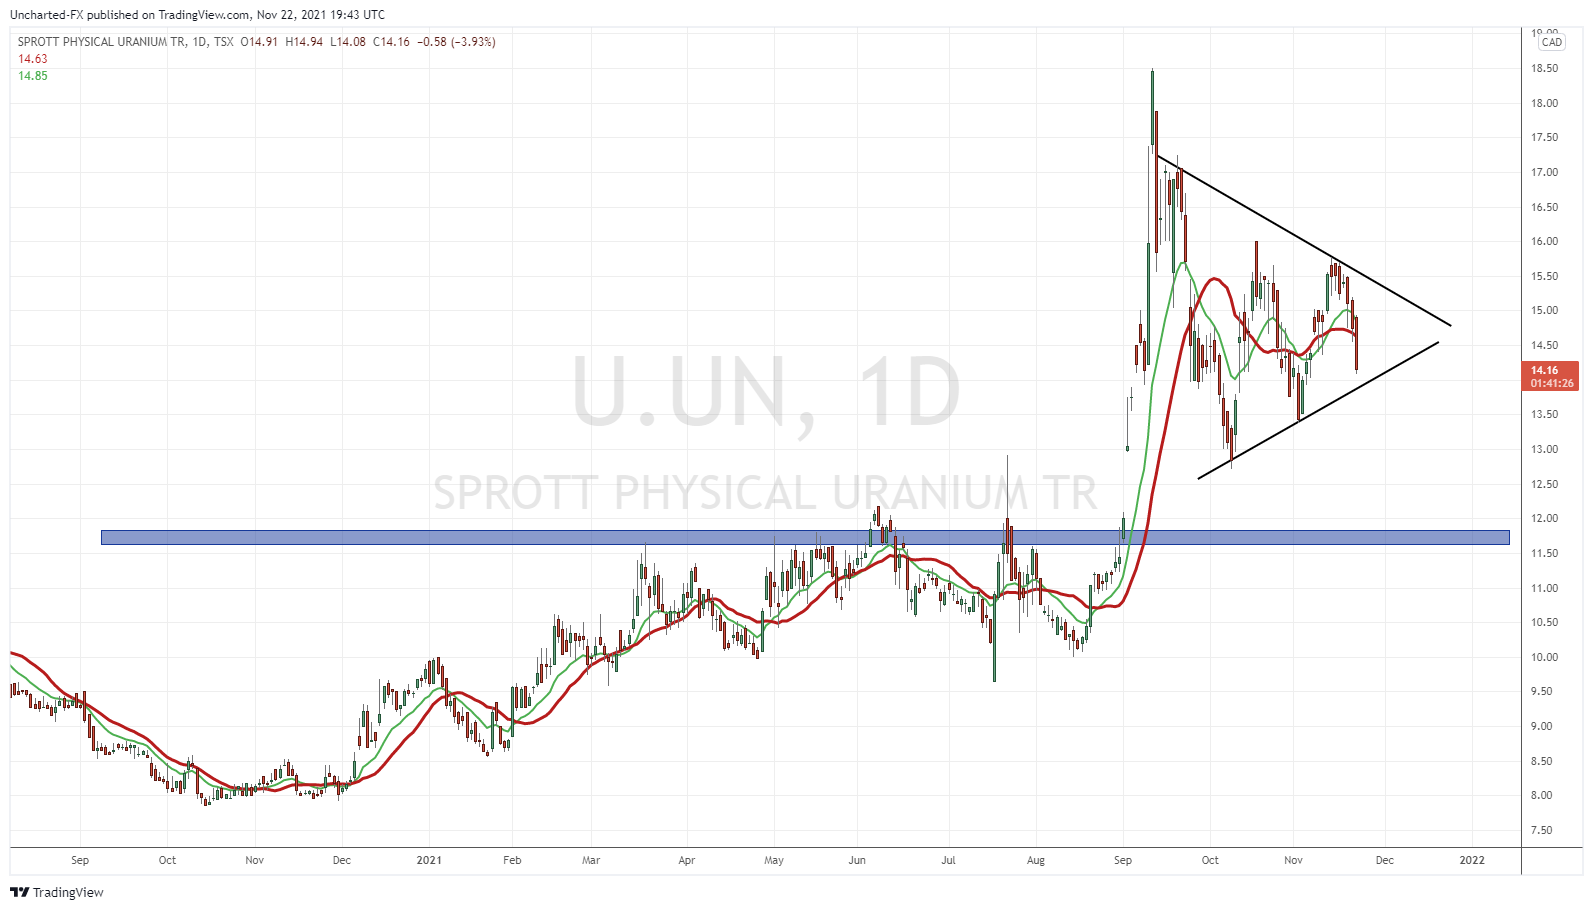
You can also use Sprott’s Physical Uranium Fund (U.UN) as a proxy for the spot price of Uranium. In fact, some financial media outlets explain the rise in Uranium prices due to Sprott’s purchases. Similar looking structure with the triangle. Just await the break.

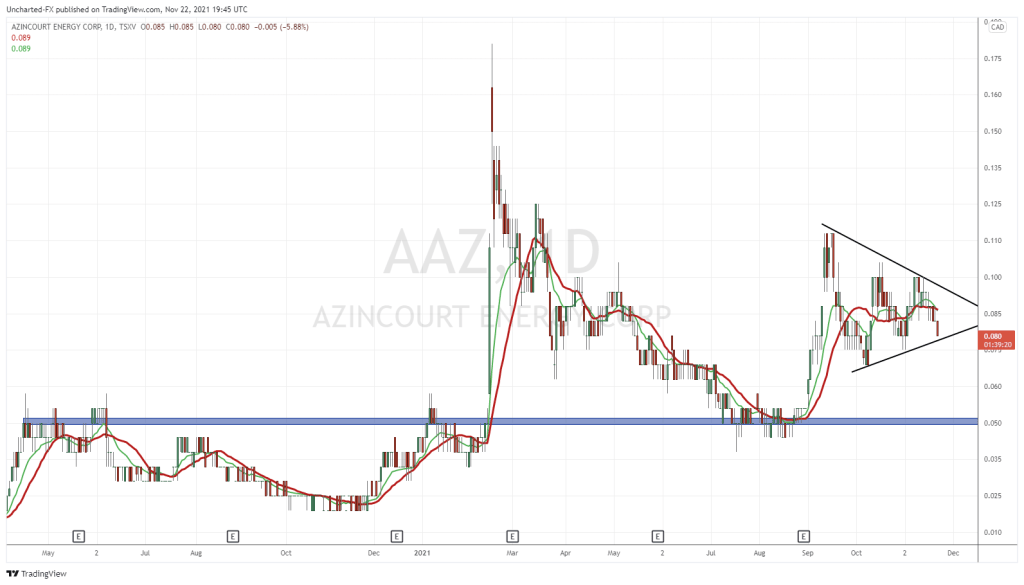
No surprise that the chart of Azincourt Energy looks similar to Uranium spot prices and Sprott’s Uranium Fund. The same structure with the triangle pattern. The stock is consolidating after a 90% pop from the recent bottom during Summer of 2021, to the recent highs around the first week of September 2021.
Now we just wait for the breakout. If the triangle breaks, it would mean Uranium is headed back down to $40, and Azincourt retraces to support at $0.05. This is a major support zone, and I would expect to see heavy buying if we do pullback there. The current market cap of the company sits at $39 million. They have an experienced team, have a cash position, and have an ongoing catalyst with drilling upcoming. Not to mention a joint venture with Skyharbour Resources. All of this while the Uranium price market structure still looks bullish for the long term. Keep this stock near the top of your watchlist.

