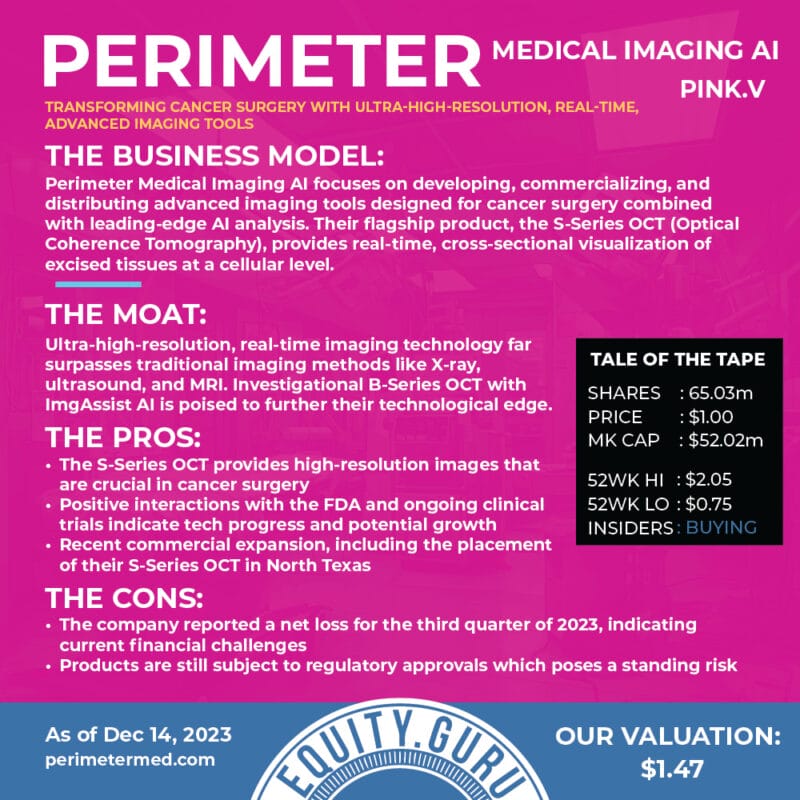
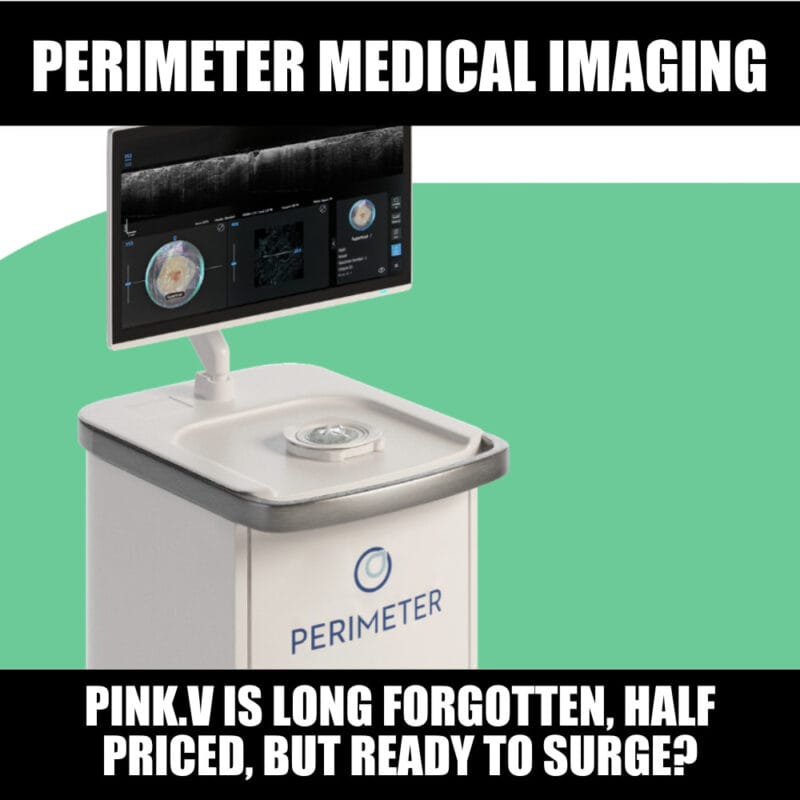
Perimeter Medical Imaging Ai (PINK) is a company that is developing, with plans to commercialize, advanced imaging tools that allow surgeons, radiologists, and pathologists to visualize microscopic tissue structures during a clinical procedure. There are many companies that claim they will either cure cancer, or do something about cancer. Perimeter Medical can claim that they are a company actually doing something about breast cancer.
Their AI tech can be used with real time visualization and assessment to improve surgical outcomes for patients and reduce the likelihood of additional surgeries.
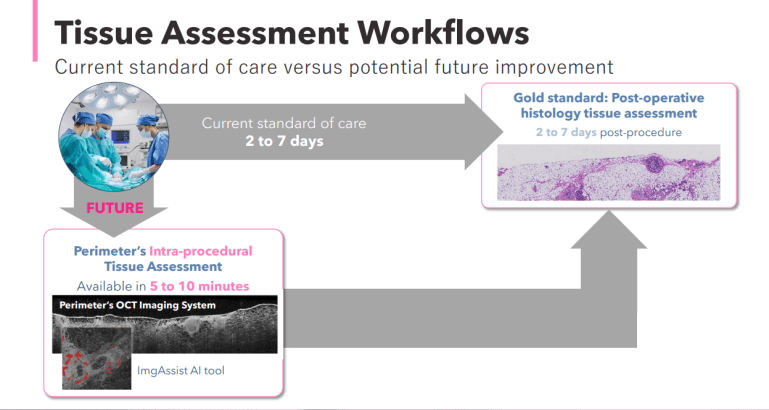
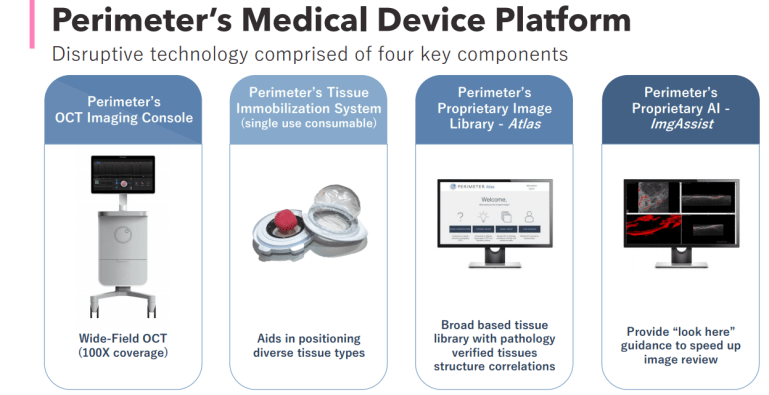
Not only will Perimeter’s technology change the current standard of care, but it will reduce costs for patients. Disruptive technology. New technology which leads to improvement, provides value to society, and lowers costs. This is what true capitalism is all about.
There is also a large addressable market. With cancer rates and breast cancer diagnosis increasing in the US and Canada, new technology to meet and alleviate this challenge provides a significant opportunity for Perimeter Medical. It is a feel good investment.
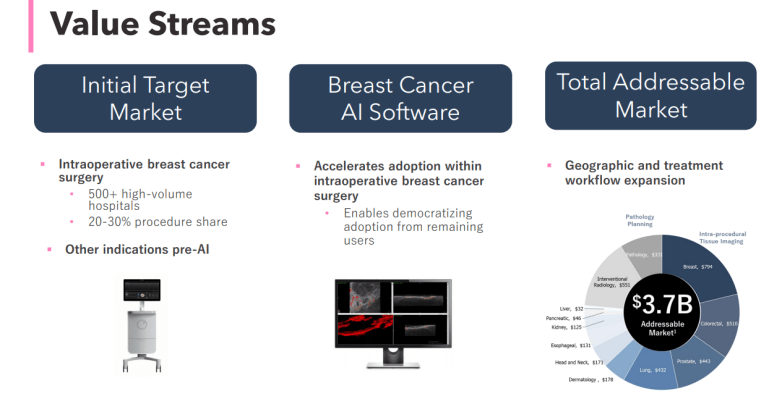
The market liked Perimeter’s recent news, as it takes the company’s tech one step closer towards a commercially viable product.
Recent news regards the approval of its Investigational Device Exemption (“IDE”) application by the U.S. Food and Drug Administration (“FDA”) to conduct a multi-center, randomized, double-arm study to evaluate the FDA breakthrough-device-designated Perimeter B-Series OCT imaging system that uses ImgAssist AI technology to identify regions of interest as compared with the current standard of care for patients undergoing breast conservation surgery. It is anticipated that over 300 patients across 8 U.S. clinical sites will participate in the pivotal study to be led by Principal Investigator, Dr. Alastair Thompson at Baylor College of Medicine.
Jeremy Sobotta, Perimeter’s Chief Executive Officer stated, “This IDE approval marks another important milestone in our ATLAS AI project, building upon the ‘Breakthrough Device Designation’ that we received in April, as we transition into clinical validation of the AI-enabled, next generation of our commercially available flagship OCT imaging technology. Trial start-up activities are already underway, with world-class sites and a number of the nation’s leading breast surgeons identified to participate in Perimeter’s pivotal study, which we anticipate initiating in mid-November at our first site at West Cancer Center’s Breast Center in Germantown, Tennessee under the direction of Dr. Richard E. Fine. Our hope is that the data generated from this trial supports our belief that Perimeter’s innovative OCT imaging technology will become a trusted tool for surgeons, resulting in better patient outcomes and lower healthcare costs.”
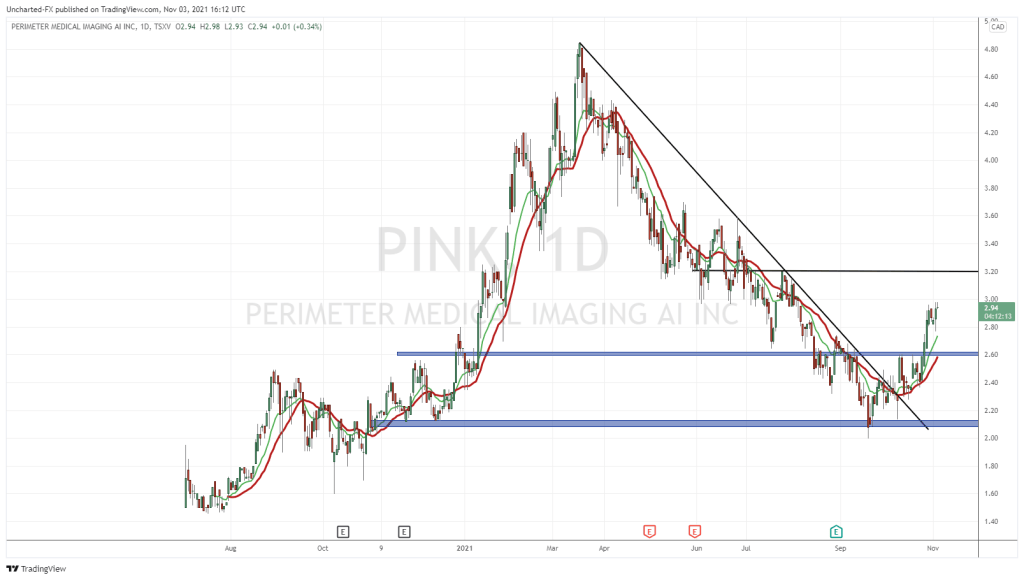
The last time I covered the chart of Perimeter Medical was back on August 23rd 2021. Let me remind you of the chart set up:
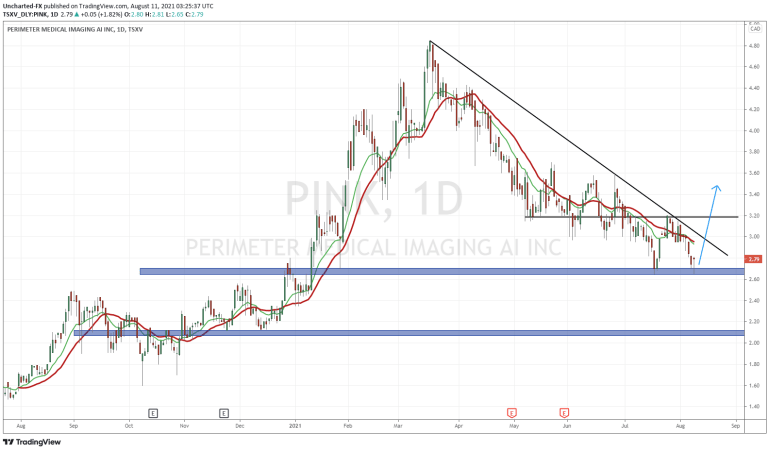
A very nice and clean technical set up. We had been in a long downtrend, and were finding some support at the $2.60 support zone. I was hoping for a double bottom pattern to form. Remember: the trigger is a breakout of the top of the double bottom pattern, or in this case, the $3.20 zone. My case for an early entry was also a close above the downtrend line that I had drawn. I think being patient and waiting for the breakout and positive confluences is super important. It increases your probability of success in a business that is all about probabilities.
This is what happened instead:
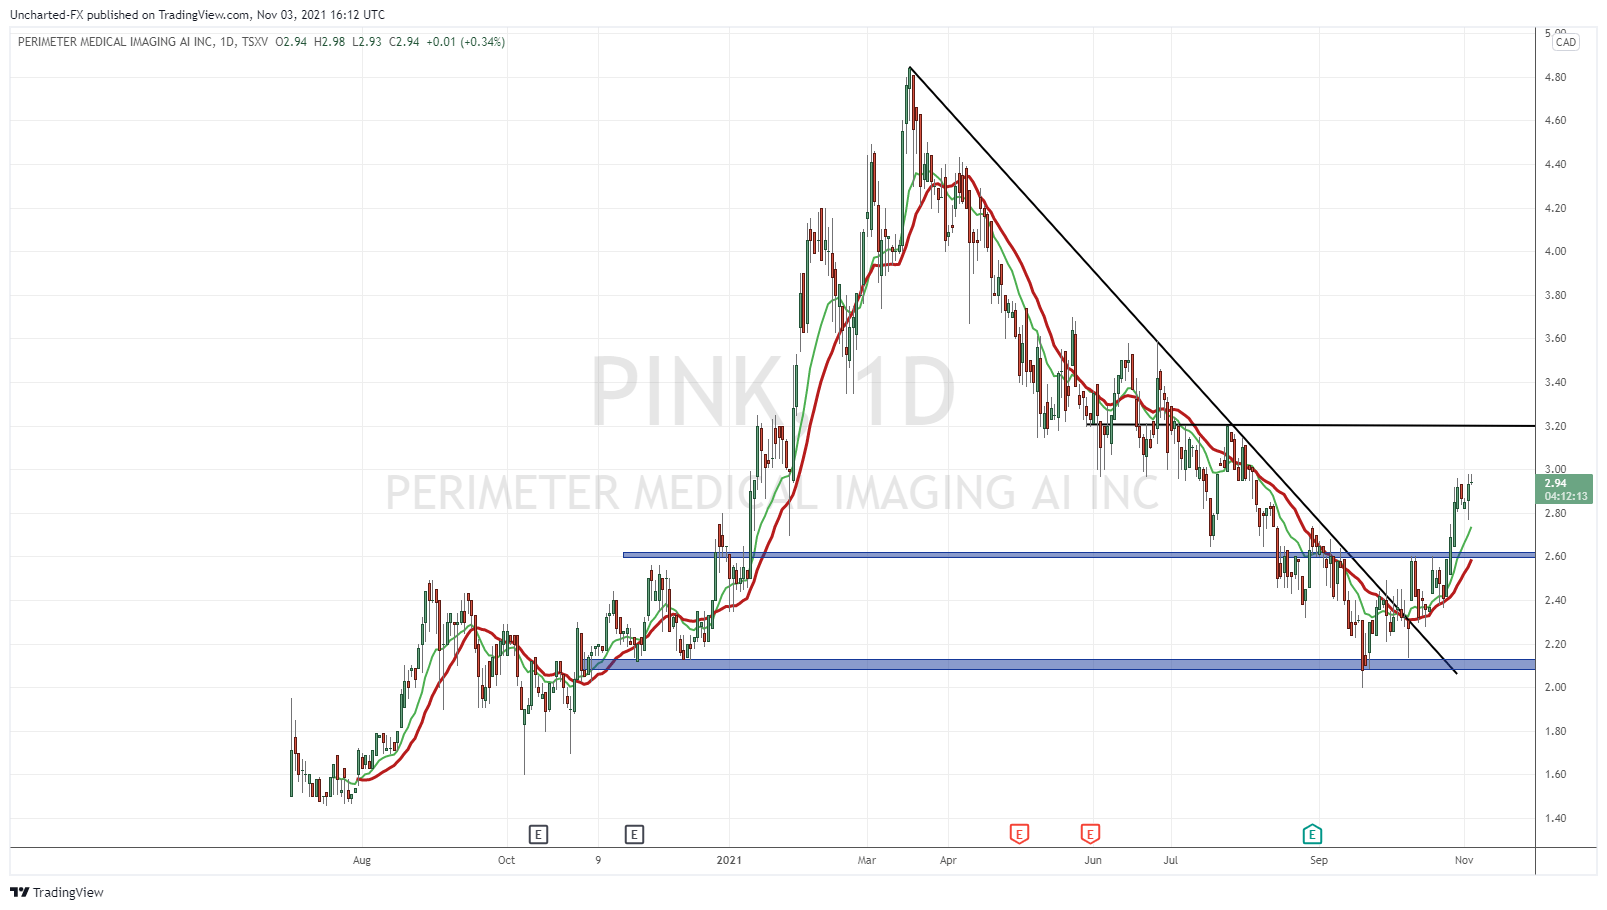
Before we talk about the obvious trend reversal, let’s take a look at what happened at $2.60. We did not print a double bottom. Instead, we broke below support, then retested it, along with my downtrend line, and continued lower. All the way down to my second support zone which I highlighted in the August coverage. The $2.00 support zone.
From here, we developed a bottom. And also a bottoming pattern. Call it a double bottom or a cup and handle, but the market structure does not lie. Once we broke above my downtrend line, the momentum was beginning to shift. The breakout above $2.60, a close back above what was once a major support zone which began acting as resistance, was a confirmation that a new uptrend is beginning. The breakout happened on October 26th with high volume (the column of data to the right below):

Honestly, if all of that sounds like mumbo jumbo to you, then don’t worry. They say a picture is worth 1000 words, so just look at the chart. I think anyone not well versed in technical analysis could still look at that chart and tell you a trend shift has occurred.
As long as the price remains above $2.60, the uptrend continues. Look at price action from November 2020 to March 2021. That uptrend. It did not occur in one straight line, but instead in waves. What we call higher lows, but in simple terms, price moves up and then pullback a bit which allows buyers to enter and drive the price higher. This is the type of price action I am expecting. Pullbacks and dips will be bought as long as $2.60 holds. Our job is to ride the uptrend wave.
One area to watch for some significant sell off will be the $3.20 zone. Just because it is a resistance zone, some investors and traders may take profits there. You then have $3.60 next. Breaking above these zones adds further to the momentum as more technical traders will notice these major breakouts.
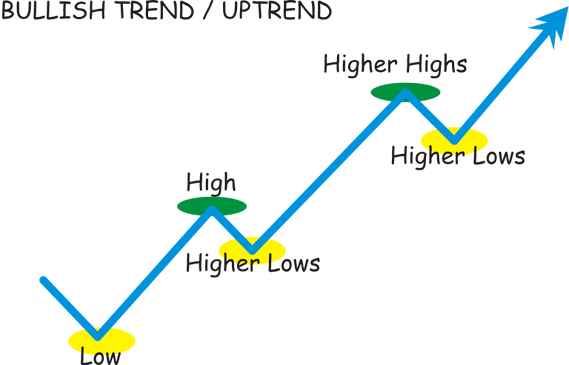
The new uptrend has been triggered, and I expect further swings to the upside. Markets move in cycles, and Perimeter’s chart shows the power of cycles. We had a nice uptrend taking the stock to highs of $4.84. And then a downtrend taking the stock down to $2.00. Notice the trend structure. Let’s watch for a repeat of the trend structure that took us to record highs!

