
Stock Markets open red this morning in what is setting up to be a big week. Mark your calendars for Friday. We have US Non-Farm Payrolls (employment numbers) for the month of September. Remember what Fed Chair Powell said at the last Fed meeting? The Fed committee believes inflation is transitory (but they might be up for a rude awakening given Oil and Natural Gas prices), so the missing piece before unveiling a tapering timeline is employment numbers. We have been seeing US Jobless Claims tick up in the last few weeks. A lot of high expectations on this Friday’s NFP numbers, and a lot rides on it. It will determine whether a Fed tapering timeline gets unveiled as soon as this month, or if the Fed kicks the can down the road further.
Why am I telling you all this? Because a taper tantrum plays a role in determining why the Stock Markets are selling off. As my readers know, I believe news is lagging. It has already been priced in sometimes months in advance. This is why the trendline breakdown I detailed a few weeks back regarding an upcoming stock market drop was super important. Things are shifting. But add China Evergrande issues, the energy crisis in Europe and China, Government debt ceiling mid October, and rising Covid cases and deaths, we have a lot of things that the markets are worried about.
I can just ‘sense’ the markets uncertainty by looking at a few charts. Primarily the US Dollar and the Ten Year Yield.
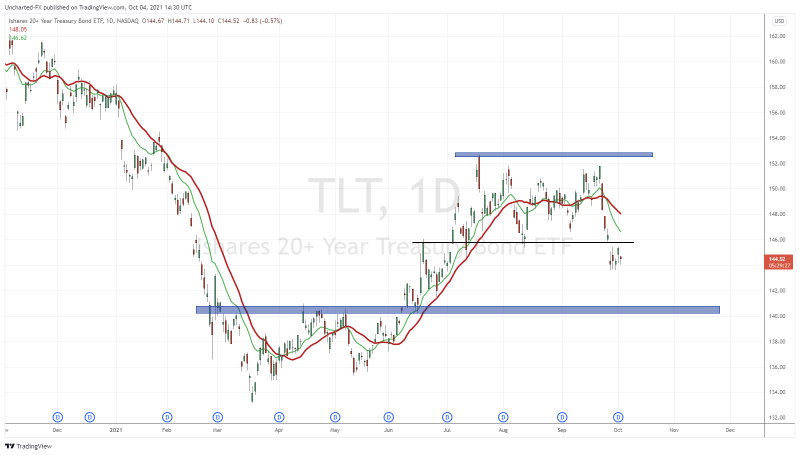
The TLT is dropping. In fact, it broke below an important support zone to last week. Historically, when bonds sell off, it means we are in a risk on environment. Money is running into stocks. When bonds move higher, traditionally we call this a risk off environment. Money heads for the safety of bonds and leaves equities following the asset allocation model. So in this case, with bonds selling off, we should expect to see money move into stocks…but that isn’t happening. Stock Market indices are selling off.
This means the stock markets are likely pricing in Fed taper. For those who believe US markets are propped due to cheap money and the Fed buying up bonds, then a taper would lead to a stock market sell off, or a taper tantrum. Think of it this way: If the markets believe the Fed is going to taper soon, then you should SELL your bonds before the Fed dumps their bond position. Lock in your gains now. This is what I see with the TLT.
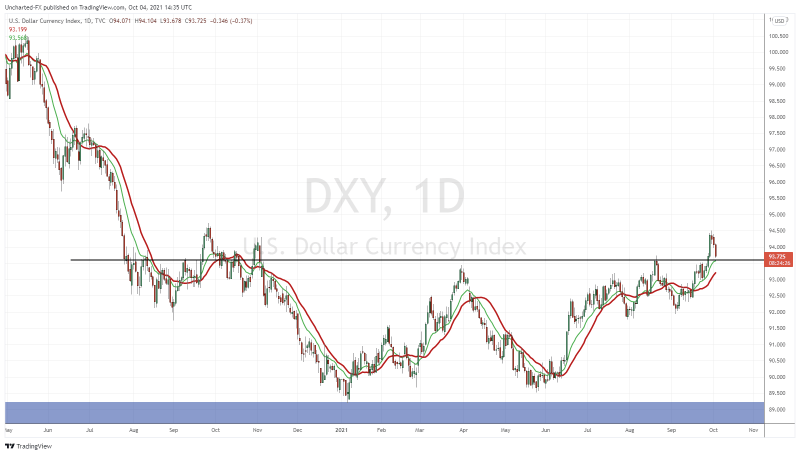
The US Dollar is down today…not something we would expect to see if money is running for safety. I would expect the US Dollar to be up when markets are falling. But here is the kicker, I think the US Dollar is just pulling back to retest the 93.50 zone before continuing higher. The Dollar may get double the reason to move higher. First a move into safety with stock markets dropping AND a stronger Dollar on a Fed taper.
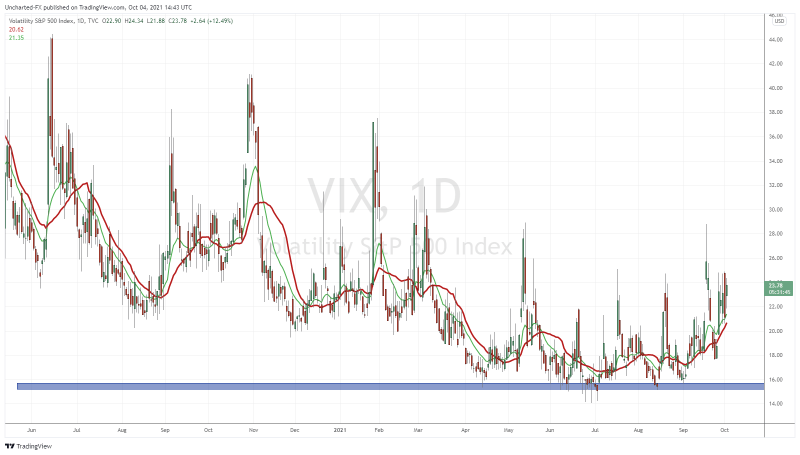
When traders and investors want to chart fear, the Volatility Index, or the VIX, is the first thing that comes to mind. We will watch this in the upcoming days. Out of all the assets I watch to determine where stock markets want to go, the VIX is the only one working right now.
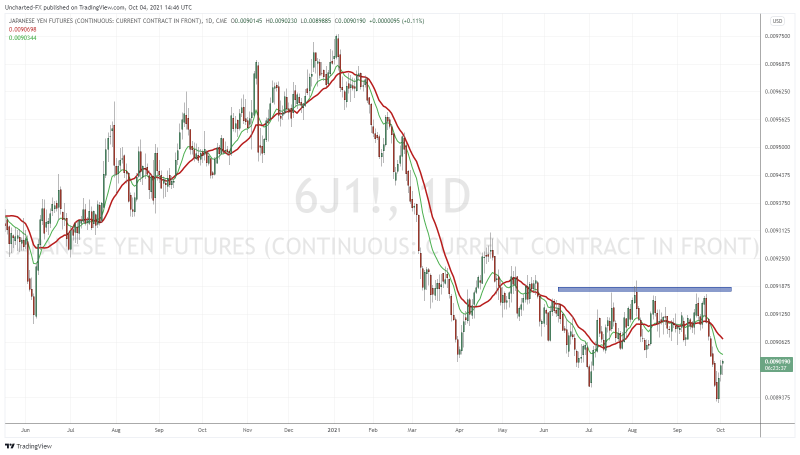
Finally, I want to mention the Japanese Yen. A lot has changed from the moment I began writing this Market Moment till now. The yen forex pairs (USDJPY, EURJPY etc) tend to have a positive correlation with stock markets since the Yen is seen as a safe haven. When markets move up, the yen pairs move up (or the Yen drops). This morning when the stock market was dropping, yen pairs were spiking higher. It definitely added some confusion. However, it seems now the Yen is gaining, and yen pairs are losing onto their gains. This means that uncertainty and fear pressures are growing.
So a big week with that NFP number on Friday. Keep that in mind as we approach closer. Before I end, let’s look at the technical set ups for the major indices. Nothing really has changed if you follow my work or are a part of our Discord trading and investing channel.
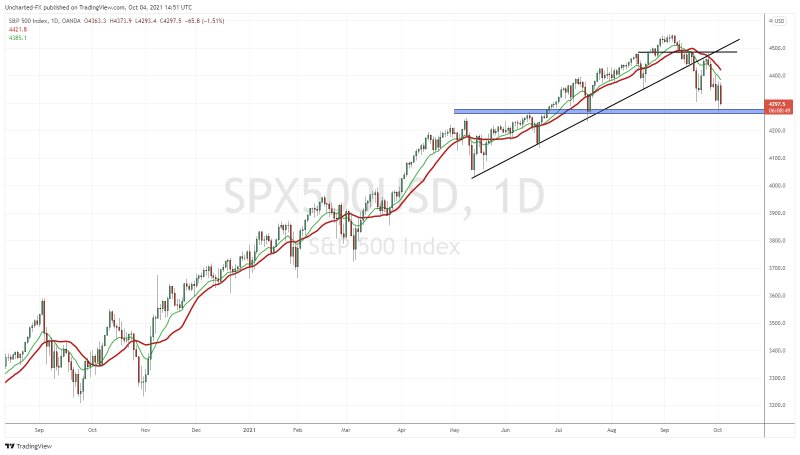
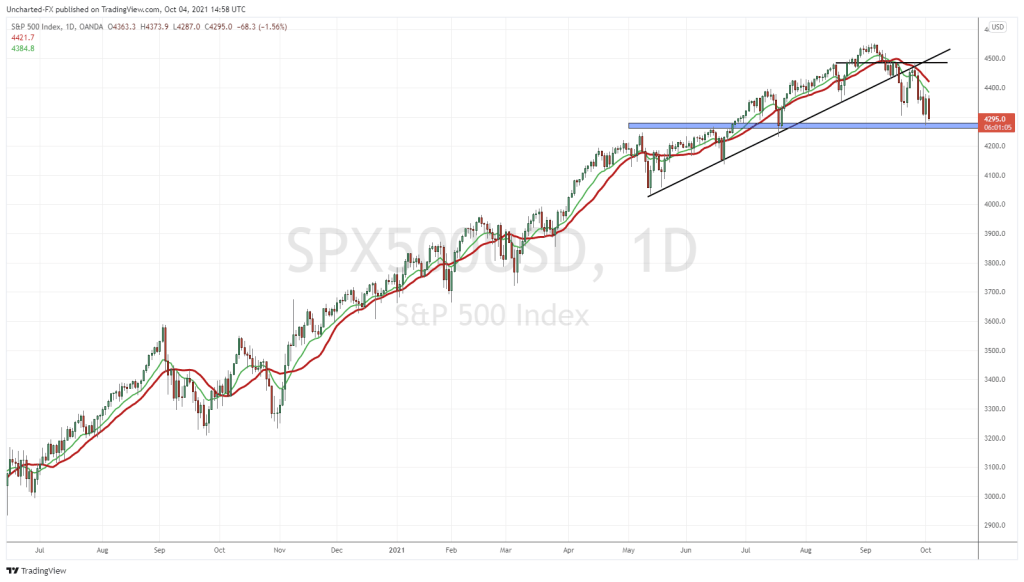
The S&P 500 has hit our initial downside target from two weeks ago. This is a major support level. If buyers were to step in, there is no better place than now technically. However, another lower high leg is possible, meaning we could break down and head to the 4100 zone. If more market pressures build and the S&P 500 closes below this support, expect more downside for the Nasdaq and the Dow.
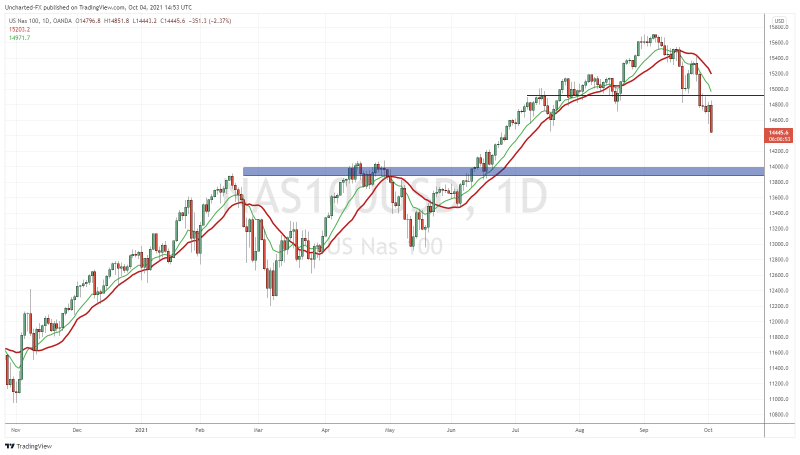
The Nasdaq is getting REKT. Last week, I reminded readers and Discord members that the Nasdaq had closed below an important support zone. The break was followed by 3 days of range and then today’s drop. To be honest, there is some interim support here, but I would be looking lower to 14,000.
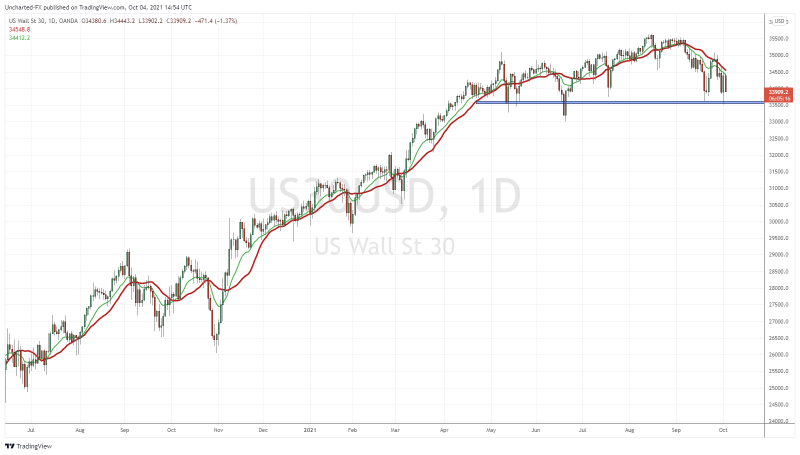
Finally the Dow Jones. Earlier on, the Dow looked good as Oil hit $78 a barrel. Yes, Oil hit levels not seen since 2014. But the Dow is following the overall markets. Technically, it is at a major support just like the S&P 500. If buyers want to defend, it must be here. There is some interim support at 33,000, but a strong breakdown could take us down to 32,000.
So the S&P 500 and the Dow are testing support, while the Nasdaq has some room to the downside. Watch the daily closes of the S&P and the Dow. Very important in determining which direction we go. Things can change, but technically, I am favoring more downside. Best case scenario? Job numbers MISS on Friday. It means the US economy is not recovering which sucks for Main Street. But it means the Fed continues tapering and we can keep buying the dips while typing ‘brrrrrrr’ money printer sounds.