Diagnos (ADK.V) is definitely one of the companies with the coolest AI tech I have come across. I would use the word disruptive. And I like disruptive. I am sure many investors do.
Diagnos scans your eye, then their AI technology goes through the data, and provides a health diagnosis. Their mission is to develop AI tools to assist healthcare professionals in the detection of critical health issues.


Be sure to listen to our Investor Roundtable, and be sure to check out our deep dive on this company. Chris Parry explains how this technology can even disrupt the way diabetes routine checks are done. The value provided by Diagnos is immense.
I am here to cover the charts, and I have to say, the chart is looking good!
Before we do, it is important to state that the pandemic really did hamper things for Diagnos. Hospitals were not so interested in pilot programs as they had other things to worry about during the pandemic. Makes sense. But now, with the pandemic being handled, hospitals are looking ahead.
Recent news has seen Diagnos pilot programs in Mexico, Spain and Saudi Arabia. The Saudi Arabian hospital even drew the presence of the Kingdom’s Undersecretary of the Ministry of Health. Overall all positive signs going forward.
Now the chart as promised:
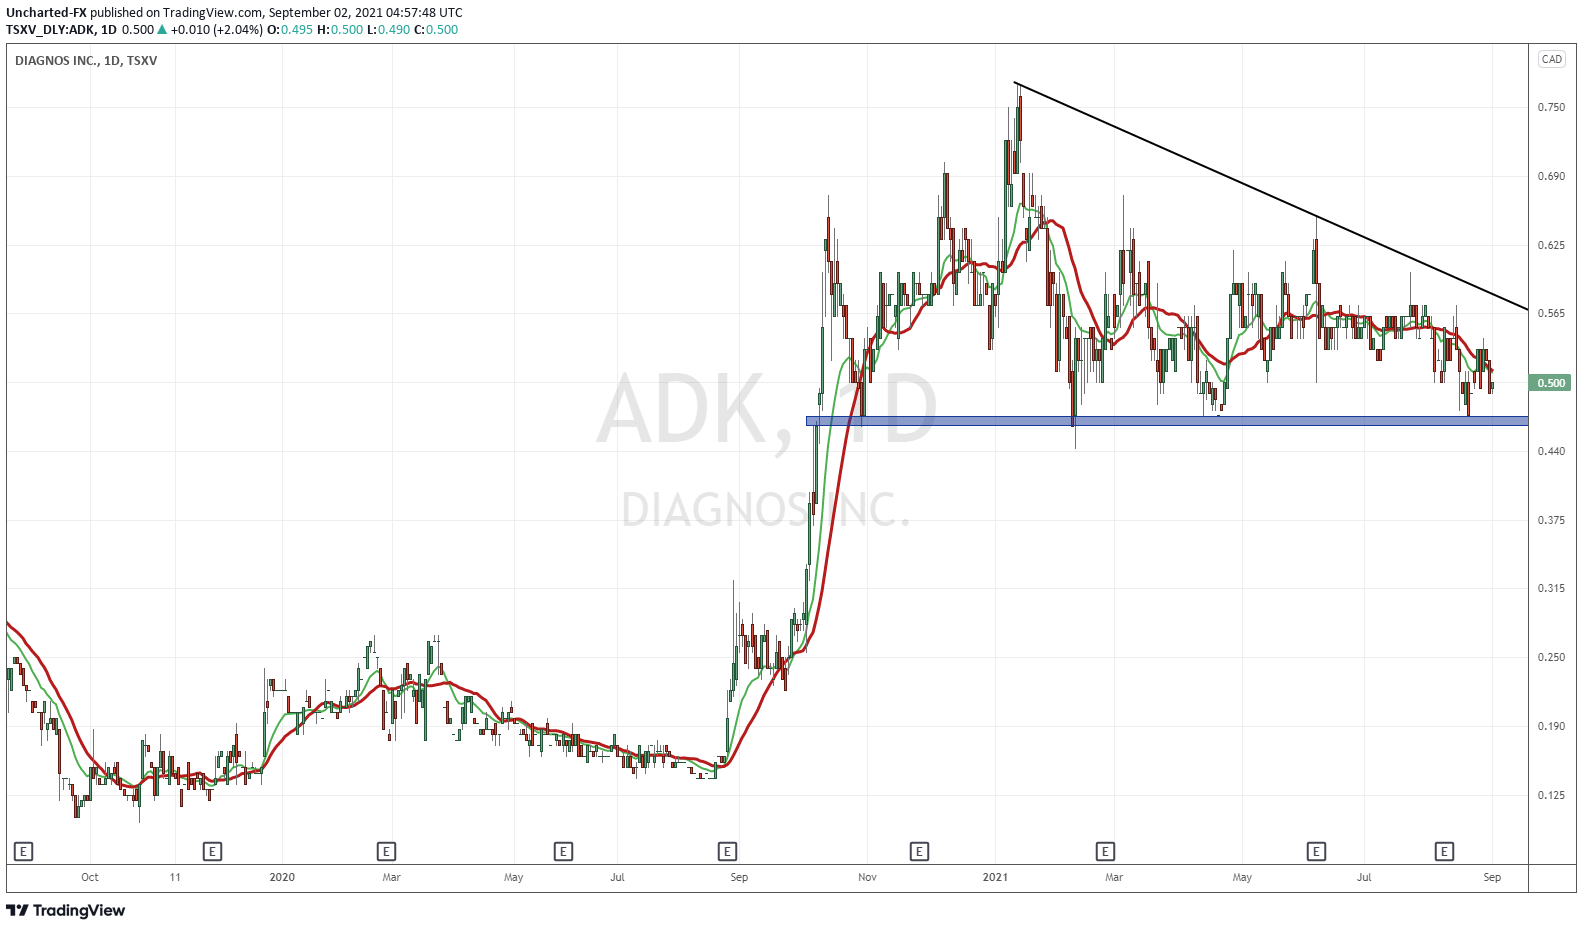
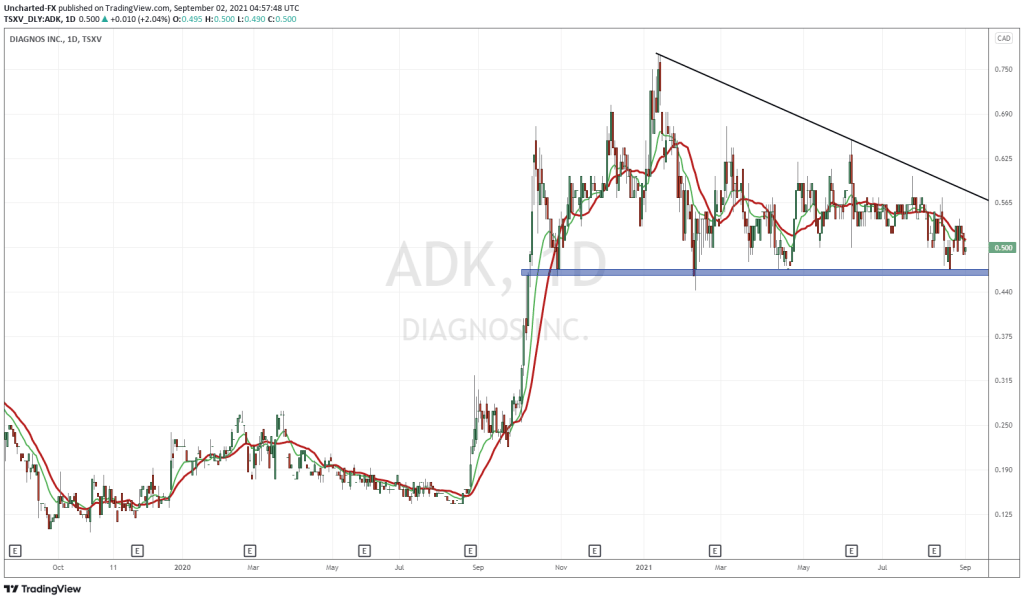
Above is the daily chart of Diagnos. A few key points to pick out.
First, the stock went on a tear last year in Fall. We broke out above $0.30, and hit highs of $0.77. Then we just slowly drifted downwards. But no necessarily in a negative way. The stock has been ranging.
Currently, we are at the $0.50 support zone. A very important support zone. Buyers defended and bought five times in the recent past. If we test it again, watch buyers to do the same.
I say this range is good because the market likes the story. It is expecting good news and a catalyst. Too often have we seen small cap stocks just dump after a large rip. Not Diagnos. There is real potential here and traders and the market knows it.
I like this support zone we are at, and it is a great zone for an entry. What would make things even better would be a nice green candle sometime next week, or even today’s close, to give us more signs that buyers are still entering and defending this support. The news flow might be slow, but the stock is still holding up. A catalyst gets this going. Notice my trend line too? Sure you do. If we can close above it (the $0.57 zone) we have major bullish breakout signals. Things are looking real good technically and fundamentally, now it is all about management.
In the case we close BELOW this $0.50 cent zone (below $0.48). That would be a bearish sign since we would have broken below support held since October of 2020. We would see more selling pressure, and the next support I have is at $0.30. Let’s hope it doesn’t come to this, but I trade the markets I see, not the ones I want to see. If this occurs, we will wait for some basing before assessing a bid.

