As we are bullish on the junior mining space, of which the bull market is JUST BEGINNING, I will be making more of an effort to find some charts of juniors that look interesting and are looking ready to breakout. So far the gains have been stellar with Impact Silver, Pure Gold Mining and East Asia Minerals all of which have been covered pre-breakout.
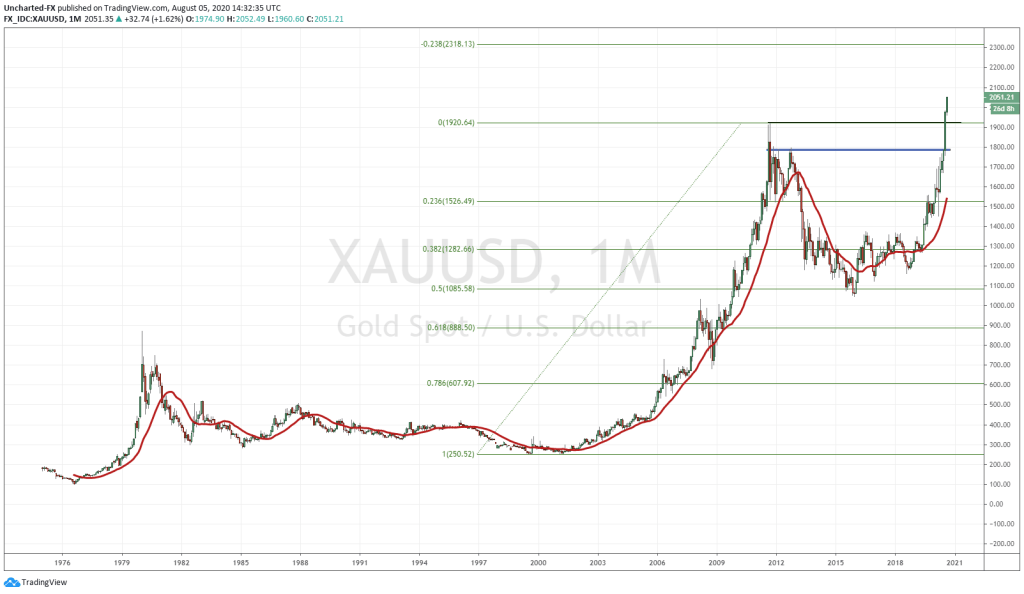
Before we look at the chart of interest, I want to mention this call by a major US bank. Goldman Sachs has targeted $30 Silver and $2300 Gold within the next 12 months. Go back to yesterday’s Market Moment post, or check out the youtube show. Take a look at my fibonacci target for Gold…to me it just proves these guys are using them…or at least have their interns writing papers and analysis using fibonacci for targets.
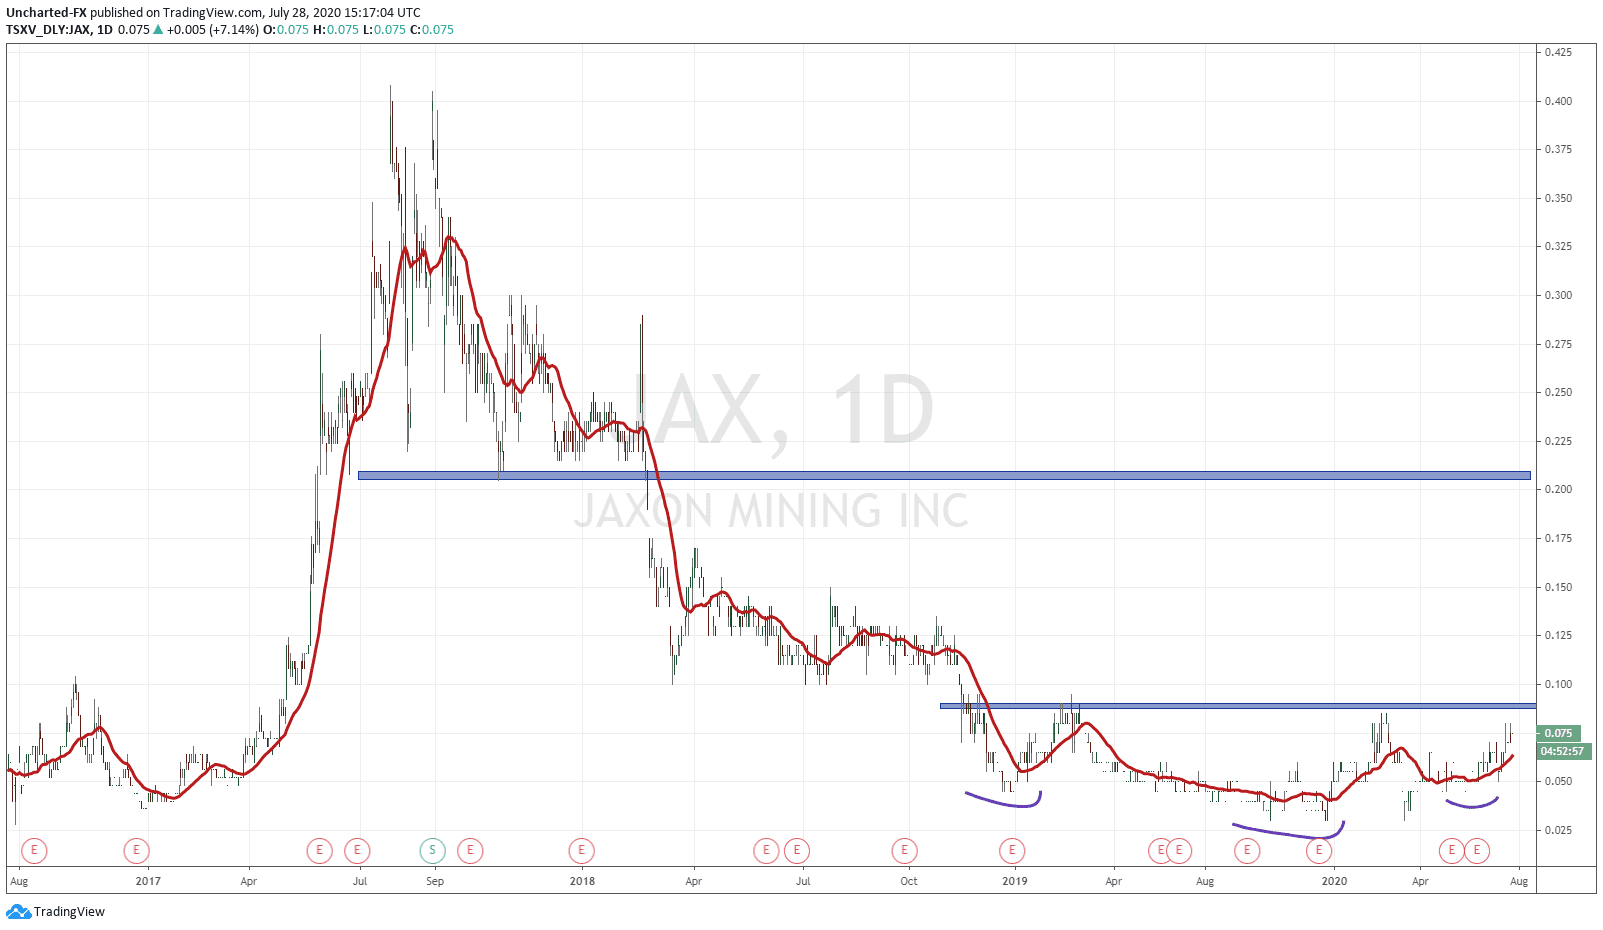
Here is the chart of Jaxon Mining (JAX.V) the fundamentals and Geology which Greg Nolan has covered wonderfully in his latest sub $20M ExploreCo Shortlist. Highly recommended intel on those who want to play this upcoming mania in the juniors.
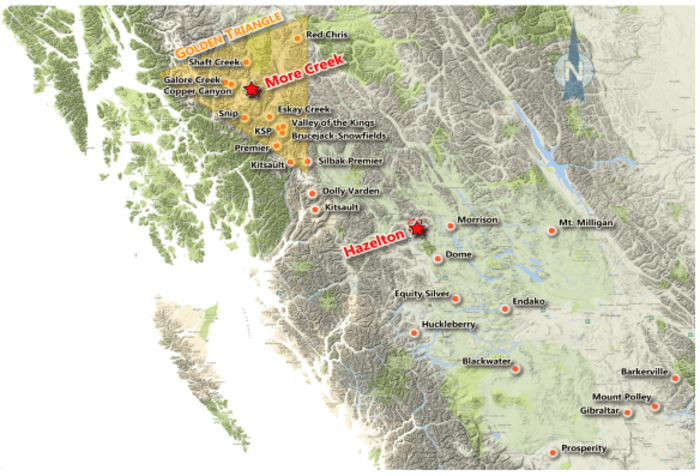
Jaxon Minings flagship project is in British Columbia, and it is the 41, 512 hectare Red Springs Project in the Hazelton region of Northwest BC.
The geology has been summarized to 4 distinct geological areas of interest:
-
Flagship project Red Springs AOI – large porphyry Cu-Mo system with large scale, distal, gold-bearing tourmaline breccia zone/pipe https://jaxonmining.com/projects/red-spring/
- Max AOI – epithermal-epigenetic structurally-controlled, high sulfidation, high-grade silver dominated polymetallic target https://jaxonmining.com/projects/max-silver-zinc/
- Netalzul Mountain AOI – large porphyry Cu-Mo system with structurally-controlled silver and associated polymetallic mineralization https://jaxonmining.com/projects/netalzul-mountain-hazelton/
-
Blunt Mountain AOI – porphyry Cu-Mo system with a 2 km long distal epithermal system with showings of Cu, Ag, Au, and other mineralization https://jaxonmining.com/projects/blunt-mountain-hazelton/
Jaxon Mining has also initiated a 2020 drill program at Hazelton, with the details as followed:
-
4-6 km2 detailed ground magnetic survey at the Razorback porphyry and gold-bearing tourmaline breccia zone/pipe at Red Springs
- Preliminary ~1000-1200 soil sampling and mapping program consisting of a systematic 50 m x 50 m grid at Razorback porphyry covering approximately 2 km2 to be conducted by HEG & Associates
- Re-logging of 2017 drill cores from Max, which intercepted 6-11 metres high-grade silver polymetallic mineralization
-
Surface prospecting including soil, rock sampling, and mapping at the Netalzul Mountain and Blunt Mountain AOIs
Now let us break down the chart. My readers and followers are beginning to see the set ups. First of all we are demonstrating ⅔ market structure movements that all markets exhibit in cycles: downtrend, range…and what would follow would be the uptrend. We have been ranging since Fall of 2018, and you know the saying: the longer the base, the larger the space (above). This type of basing pattern is the same that I have used to call the Gold move last year, and recently, used the same pattern to trade GDX, GDXJ, Pure Gold Mining and East Asia Minerals. What do they all have in common: they are all winners.
As you can see from my drawing tool, another pattern has caught my attention. It appears we have an extended head and shoulders pattern. Remember, all this pattern does is show is a shift in trends. In this case a shift from a downtrend (making lower highs) to an uptrend (making higher lows).
What would be our trigger is a breakout and a candle CLOSE above 0.09.That is the resistance zone we are working with, AND would confirm the head and shoulders pattern with a confirmed right shoulder and higher low. The current drill program results could be that catalyst to get us this break. But of course, being a technical trader myself, I would wait for the breakout. First target for the trade would be the resistance zone at 0.21 cents. A nice 100% return if we can get in on a breakout exactly at 0.09 or 0.10 cents.