Two of our resource clients have been active traders in recent sessions. There’s been some nice price and volume movement. But no significant catalyst behind the moves, not that I can see, cept for the fact that both companies appear waaay undervalued based on the quality of their project portfolio.
We’re talking about Nexus Gold (NXS.V) and Cypress Development Corp (CYP.V).
Before we dive in for a closer look at the recent price action, a word or two on technical analysis (TA) and its relevance/usefulness in today’s volatile helter-skelter markets.
A lot of traders and investors dismiss TA. Some compare it to gramma’s obsession with tea leaves, some think it’s voodoo, some call “shenanigans” declaring trickery of the highest order.

Some, presumably those who are too lazy to examine it objectively, go all ape shit at the mere mention of a squiggly line on a price chart.
Here’s the thing: If you believe humans are malleable creatures and, by nature, predictable in their behaviors and reactions when exposed to specific stimuli, you might want to take a closer look at this TA thing.
Auction arenas, whether we’re talking about a Stradivarius, a Basquiat, a second hand articulated dumper, a spa-day gift basket, or a junior exploration stock, can be emotionally-charged environments. They often generate predictable behavioral patterns (excitement, anger, fear) among attendees, especially when the lot on the block is a highly coveted item.
These behavioral patterns, as demonstrated via a rapid series of bids can be plotted on a price chart to form a visual reference.
These price charts can then be viewed from a completely different angle. They can serve as a reflection of the human psyche at work in the auction arena.
This is where it gets interesting: The price patterns formed on charts, from one asset class to the next over a variety of timeframes, often share common characteristics as emotions (prices) ebb and flow.
If you recognize a common price pattern in a stock you are following—one that is in the early stages of evolution where a large and powerful move is often the end result, you may have one helluva setup on your hands.
These insights can provide an edge—a blue print if you will—in navigating the markets.
This is the allure of TA.
Example: if you study the historical price charts of a number of gold companies from the previous gold bull market cycle (2001–2011), you’re going to find common accumulation patterns that could serve as road map for the price action you are witnessing today.
Admittedly, this view is from 40K feet and is an oversimplification, but you get the idea…

My thinking is this: TA is a tool for your arsenal. It’s a tool that can complement traditional fundamental analysis. It’s a tool that can help structure your thinking, particularly when attempting to target logical entry and exit points in stocks and other tradable securities.
I can give countless examples where TA helped nail favorable and sometimes canny entry points for stocks and commodities I needed to own. But far more meaningful and profound were the times when it saved my ass; when it prompted me to exit a position immediately prior to a major a breakdown.
One such trade took place during the last gold bull cycle. An Aus-based gold producer operating a number of small mines grabbed my attention from a fundamental point of view. It looked undervalued to me, but I was wary—it should’ve been trading several multiples higher based on the market caps of several similar small-time producers.
I purchased the stock at a zone of price support, at around $1.00 if memory serves. I watched the stock trade between $1.05 and $1.25 in subsequent sessions, but when it began testing that $1.00 support zone again, dipping into the mid $0.90s, the chart was telling me there was trouble ahead.
I exited my entire position at a small loss. A few days later – no shit – the stock was halted, and it remained halted. It would never trade on a Canadian exchange again. It resumed trading on the OTC market in the US at roughly a penny a share some time later. Apparently, the company ran into troubles with refractory ore. It was essentially bankrupt. TA tipped me off. Had I not applied disciplined but very simple TA rules to the trade, I would have been down over $25K.
The same danger signal presented itself with at least a dozen other companies I had positioned myself in during that amazing 2001–2011 gold bull run. I was able to beat a hasty retreat from a good number of them before things got ugly.
Another example? Here’s a 10-year weekly chart of Guyana Goldfields.
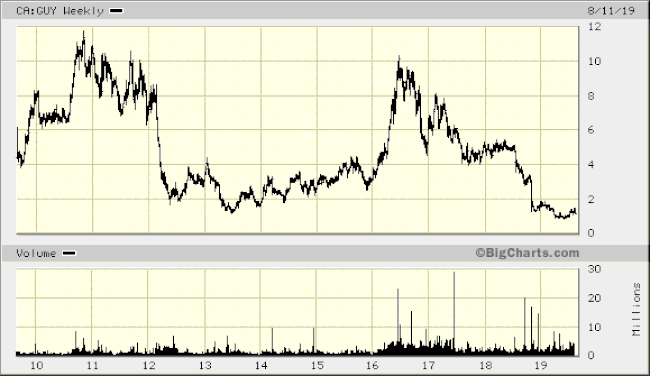
Back in December of 2011 (left side of the above chart), I took advantage of seasonal weakness in the stock and put on a decent sized position at a level I interpreted to be solid support (around $6.50). The stock responded very favorably as we entered 2012 (rising roughly 30% in a few short weeks), but it had a difficult time holding onto the $8.00 level. That was my first red flag.
Uncertain, as the stock chopped around both sides of $8.00, I bowed out of my position in the first quarter of 2012 when that important support zone began to break down. You can see what transpired next—GUY dropped from $8.00 to $2.00 in the space of only a few months. The selloff was triggered by a news event, but TA telegraphed the danger ahead of the collapse.
I applied the same discipline to Metanor, a small Quebec gold producer with lofty ambitions of financing its aggressive exploration plans via production revenue, and Alexis, a company with the same damn pie-in-the-sky game plan (NEVER trust a smaller producer that believes they can fund aggressive exploration with free cashflow). Both stocks broke down from critical support levels. My TA skills allowed me to sidestep carnage that would have resulted in a 90% plus hit.
The junior exploration arena can be a dangerous place…

How to acquire these TA skills you ask?
TA is not rocket science. Don’t let anyone ever attempt to convince you of that (many newsletter writers who charge fat subscription fees may try).
My advice is to simply learn the basics—TA 101. Learn what a support and resistance zone is. Learn what a moving average and trendline is. This basic knowledge will help structure your thinking. It will help you target logical entry and exit points in stocks you want to own—stocks already green-lighted for purchase by your own exhaustive (fundamental) due diligence.
There are plenty of free online sources who will teach you these basics.
Support, Resistance, Trend lines, Moving Averages – the Basics
If you develop an appetite for deeper insights, I can’t recommend the world of Linda Bradford Raschke enough. The woman is a TA wizard and hero of mine.
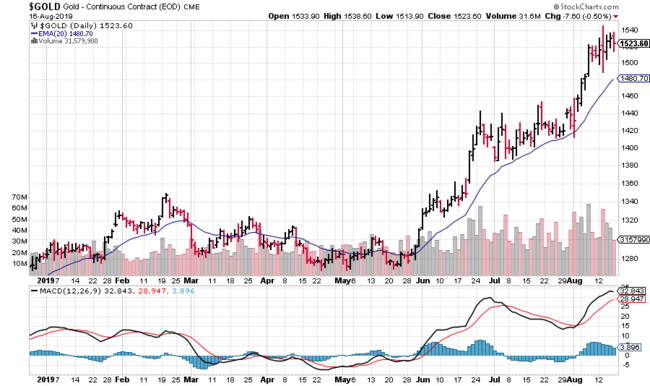
Gold
Looking at the gold and silver market, the price action has been nothing short of resplendent in recent weeks.
A stair-step price pattern is a highly desireable and constructive pattern.
There are a plethora of reasons for this recent strength in the metal. We point a few of them out in the following Guru offering (note the insights of serially successful hedge fund kingpin and billionaire, Ray Dalio):
I come from a camp that believes gold should always be valued as a relevant monetary asset. But if we look closely at some of its more immediate underlying dynamics and fundamentals, we need not look any further than the breakdown in bond yields.
Bond yields are what mainstream investors are focused on right now.
The inverted yield curve explained and what it means for your money
The spread between 2-year and 10-year bond yields have just inverted for the first time in 12 years.
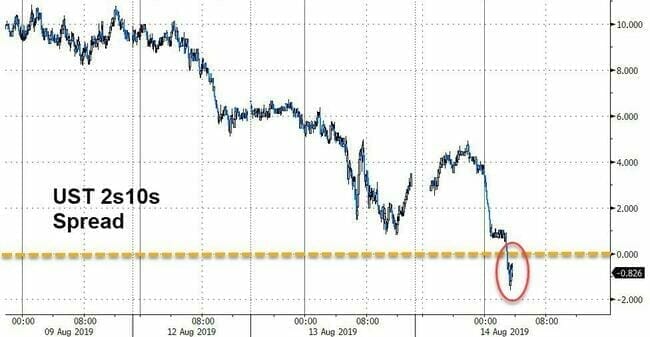
According to market watchers who track these inversions, we’re now roughly 22 months away from a recession. Tick tock Mr. Trump.
With the threat of a recession, the market has suddenly become averse to risk. Safe haven assets are now all the rage. That is why gold is catching a bid. Arguably, gold is the mother of all safe haven assets.

This current bull market in gold, depending on how you are positioned, has either been a boon or a bane for investors. Companies higher up the food chain – the mid to large gold producers – are reaping heaps of benefits market cap wise. Those further down – the ExplorerCos – are basically doing the square root of dick.
When gold made a similar move in back early 2016, the vast majority of asset-rich ExplorerCos were making early investors filthy stinking rich by this time of the year. With very few notable exceptions, the vast majority of today’s ExplorerCos are sucking wind. Very frustrating, this.
Again, there are exceptions.
Nexus
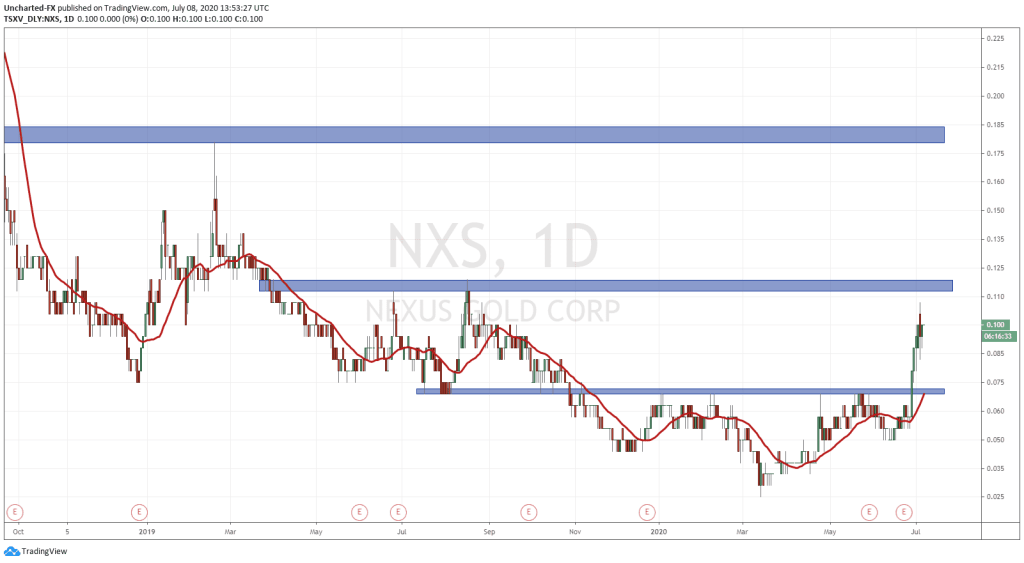
Nexus Gold has put on a very decent show in recent sessions.
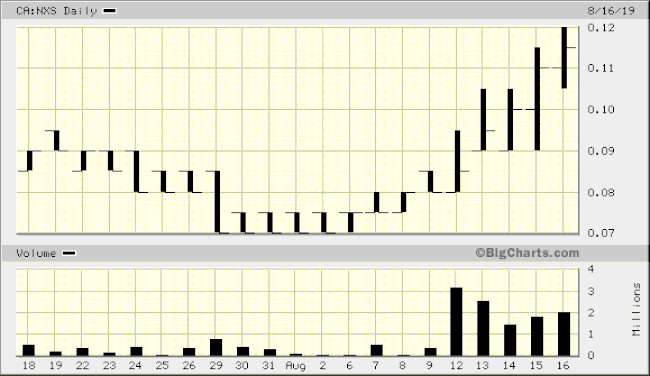
If this share price move was NOT accompanied by significant volume, I’d temper my enthusiasm. But looking at the volume (the solid black bars at the bottom of the above chart), it would be reasonable to suggest, “something is going on behind the scenes over here.”
I have no special insights. I haven’t reached out to the company lately—not that this highly regarded management team would divulge information that is not already in the public domain—and I haven’t scoured the online forums for the latest gossip.
This is where TA might offer some clues.
Taking a broader look at the Nexus chart, we are in the midst of testing an important downtrend line. Last Friday (August 16) we breached that line and closed slightly above it, on waaaay above average volume.
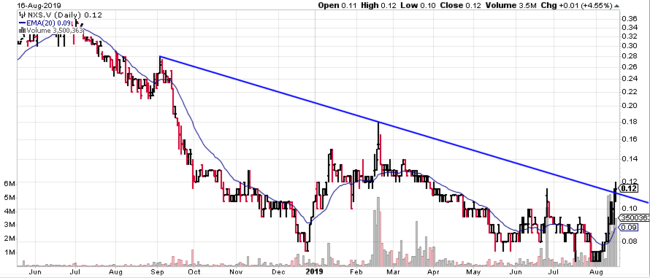
This is the kind of price action technical traders look for.
One possibility: With the company in full-on acquisition mode in recent months, it may be on the verge of trotting out yet another significant acquisition.
Nexus Gold (NXS.V) sets its sights on yet another acquisition in West Africa
The next few weeks will be important for stocks like Nexus.
Cypress Development
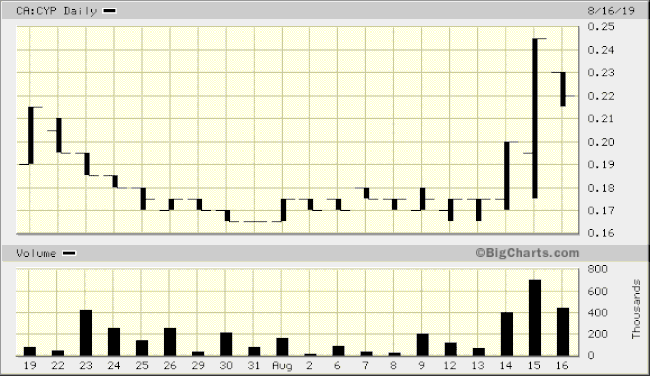
Cypress, our world-class lithium development play, is also shaking off its malaize and trading with a degree of authority in recent sessions.
Since our last coverage, the company closed an oversubscribed private placement (PP), stoking its coffers with an additional $1.1M in cash.
Pulling out for a broader view, it too is testing an important down trend line:
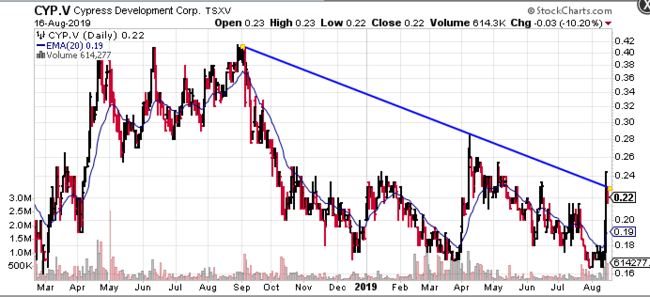
Cypress is due to release a prefeasibility study (PFS) on its Clayton Valley lithium project any week now. If the numbers are as I suspect – if they mirror the robust numbers tabled in last years scoping study – Cypress shares will likely undergo a serious re-rating.
The market may already be sensing a positive development on this front.
This recent price action may also be related to speculation that the company is about to bring in a strategic, deep pocketed partner. Such a move would likely command a significant push higher.
Final thoughts
Ball of confusion—that’s what the world is today.
Central bankers around the globe are “managing” economies that are waaaaaaay over-leveraged, imbalanced, and in many cases, on the verge of collapsing in upon themselves (authors humble opinion). The major indices—the destination where the vast majority of global investors have parked their retirement funds—might best be described as ‘a world of hurt.’

The migration into safe haven (real) assets could gain momentum in the coming weeks and months as rattled investors run for cover.
What does the remainder of 2019 hold in store for us? No one can say with any degree of certainty. These are uncharted waters.
If pressed, I’d say that after a modest correction, or a period of consolidation, gold will push higher testing that all-important $1,700 resistance level by year end.
The general indices like the Dow 30 , the S&P 500 and the Nazdog? NnGulp…
Not sure where to tuck in amidst all this market turmoil? I suppose there’s always this tack:
Dude Bet $100,000 on a single number, won $3.5 million. pic.twitter.com/umQ6S7htoA
— DRIP (@DRlPTER) August 15, 2019
—Greg Nolan
Full disclosure: Nexus and Cypress are Equity.Guru marketing clients.