As someone who has been following the crypto charts of Bitcoin, Ethereum, Ripple and Stellar more closely these past few months, it seems we are finally get that move backed by momentum we have been waiting for. The crypto charts have been nice, but we saw a lot of breakouts sizzling out as no momentum carried price higher.
I mean take a look at this weekly chart of Bitcoin. If we close above 14,000 by the end of this week, it is a huge breakout. Just above 16,000 would be the next resistance (price ceiling) level, and then if we manage to break and close above that…the big one. Record highs around 19,891 would be the next target, and we will surely surpass that.
The charts of Ethereum, Ripple and Stellar are also showing signs that they want to follow along. I am seeing breakouts on the 4 hour charts, pointing to a rally for crypto’s.
This move could be because of the big drop in the US Dollar, which is aiding in propping up Gold and Silver as well as the US stock markets. Or the move in crypto’s could be for two other larger events coming down the horizon.
Firstly, it could just be a way to get out of fiat currency, similar to the Gold and Silver. With central banks all close to 0% interest rates (some even in the negative), and central banks continuing to print money, we are seeing the beginnings of a broader currency war. With a weaker US Dollar, it means a strong Euro, Pound, Yen, Loonie etc. A stronger currency is not what these nations want in order to attempt an economic recovery. This is leading to a broader currency war, with even the European Central Bank stating they are watching the Euro and could take actions to weaken it. But then again, that would imply a stronger US Dollar.
Just furthering this point, but we have just heard the Bank of England is increasing their bond purchasing program by 1.2 Trillion. Will the Fed be next? There is a Fed rate decision today.
Secondly, market participants could be making moves to front run the eventual digital currency. The “Banking for All” Act states digital wallets to be provided to all Americans before January 21st, 2021. In this type of system where governments can track and tax ALL money, does Bitcoin become the new gold in that type of system?
Recently, corporations have made a move into acquiring crypto, or utilizing crypto. I am of course speaking about Square buying 50 million worth of Bitcoin, and Paypal embracing cryptocurrency with a digital wallet to store cryptocurrency, and the ability to purchase and use cryptocurrency.
My readers know I am more of a chart/technical guy, and there is a stock which has caught my attention.
NetCents (NC) allows businesses and individuals to accept cryptocurrency payments. From their home page:
NetCents, the transactional hub for all cryptocurrency payments, equips forward-thinking businesses with the technology to seamlessly integrate cryptocurrency payments into their business without taking on the risk or volatility of the crypto market.
When your customer pays you in Bitcoin or other cryptocurrencies, NetCents guarantees the sale price in your local currency and you receive the payment directly into your bank account.
Our very own Crypto expert, Joseph Morton, covered NetCents and their latest news of adding credit card payments as a method to purchase cryptocurrency. His article can be read here.
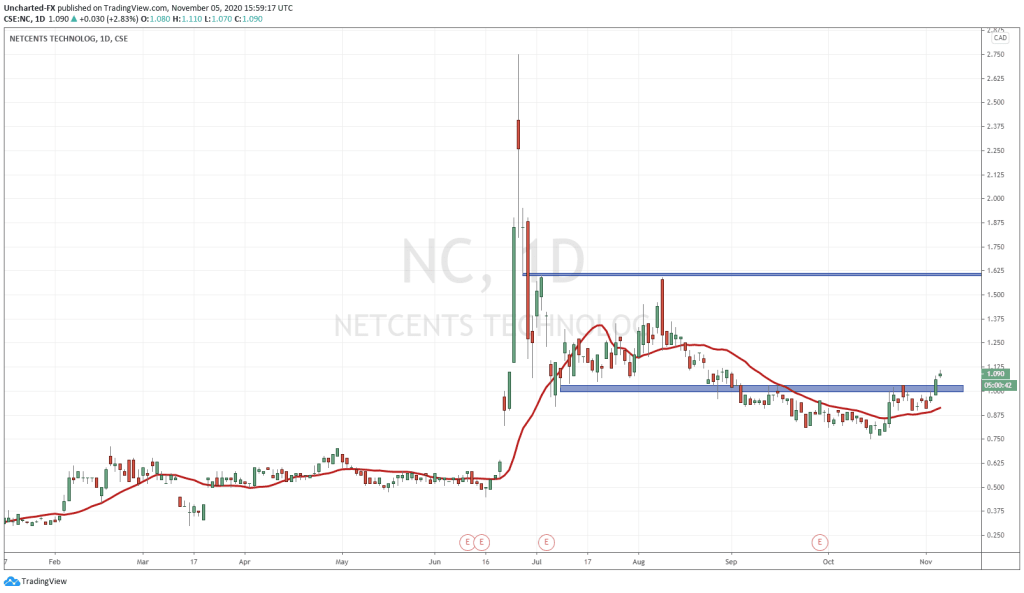
NetCents chart displayed a reversal pattern, and we have the breakout confirmation.
First of all, there is a major support zone at 0.75, where price based. This support zone was important because as you can see to the left, it was where price broke out and shot up higher to 2.75. As my readers know, price eventually pulls back to the breakout zone in order to retest it before continuing the trend. This applies to all markets.
Price then printed what can be seen as a dirty head and shoulders inverse pattern, or a pretty solid looking cup and handle pattern.
You can see I have my blue resistance zone at a previous resistance zone. Another strong confluence is that this resistance zone also was at the very psychologically important 1.00 zone.
Yesterday, we got our breakout confirmation with a candle close above this resistance. It also triggered the cup and handle pattern. From here, we either will pullback to retest the 1.00 zone as support, or we continue higher with the strength and momentum of the Bitcoin and crypto move. The higher low swing which we are working with is at
There is a minor resistance at 1.30, but the major resistance zone comes in at 1.62. That would be my swing trade target. If we break above that…we can see the previous record highs being hit. Very interesting as it is a similar swing approach to the Bitcoin weekly chart in terms of next resistance levels.


blah blah blah
Joe Charland, your ideas are greatly welcomed! On behalf of the entire Equity Guru staff, I want to thank you for sharing your insights. The succinctness of your communication is exceeded only by its depth and wisdom.