

The price of gold has defended and bounced off of two week lows, but my technical eyes have caught something. Once again folks, I trade the markets I see, not the markets I want to see. I remain long term bullish gold and silver, but am open to play downside moves.
Let me present a case for POTENTIAL downside for gold if certain price levels trigger. Alternatively, I will give you my bullish triggers as well.
Let’s start off with the longer term monthly chart:

Ever since breaking out above the $2000 zone back in November 2023, gold pulled back to retest this zone before taking off. We have had 4 green months in a row. The current candle shows a slightly green body. This is for the month of June 2023, and at time of writing, we still have one final full day of trading before this candle closes. Green means gold would have 5 full months of green.
What I want to focus your attention on are the large wicks on the three most recent monthly candles. We can see there are sellers around the $2411 zone. But those large wicks are telling me that we should expect some pullback.
Now to the daily chart.

This is where things get interesting.
Gold has been testing the support zone around $2280 in the past few weeks. At time of writing, gold has tested this support today and is set to print a nice large green engulfing candle. The bulls are stepping in strongly here.
Some of you may see what I am seeing. Yup, a head and shoulders pattern could be in play.
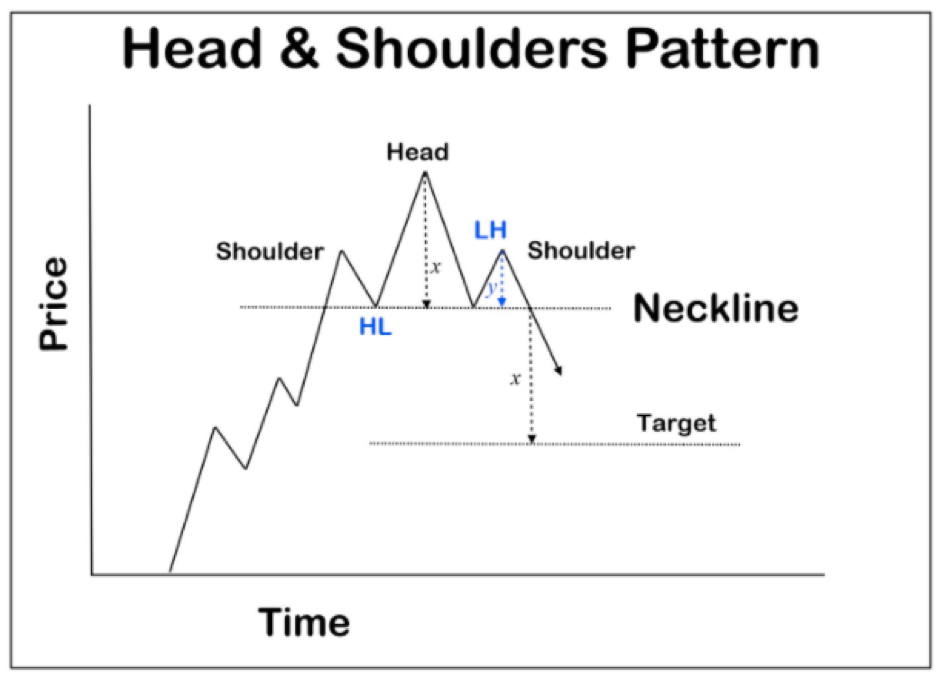
This pattern is a topping pattern and indicates potential reversal. I say potential because one does not go short simply by seeing this pattern on the chart. One must wait for the trigger. In this case, a breakdown of the neckline or support.
For gold, this means a close below the $2280 zone.
If gold closes below this, we have a head and shoulders pattern trigger, and the target would be around the $2100 zone. In case of a breakdown, bulls would want to see a quick reclamation of the $2280 zone in order to trigger a false breakdown or fake out.

Alternatively, this support holds and gold closes above the downtrend line I have drawn out. This would set us up for a move back to the $2400 zone and keep the uptrend intact.

I am also watching the intraday 1 hour chart closely. Gold is testing a key resistance zone… which could see where this pop could stall. If gold can get a nice 1 hour intraday close above the $2336 level, then the likelihood of a break above the current downtrend line increases. Note that we have seen some hourly wicks and a few red candles. This zone is being tested as resistance.
Let’s look at a few other markets which could indicate some gold sell off.
I do need to mention my recent article published this week regarding a potential risk off environment. This all remains in play, and would include a sell off in gold.

The US Dollar recently broke out of the 105 zone. In my opinion, this is bullish. The Dollar is making higher lows and higher highs and could make a run to the resistance zone around 106.60. A continuation through this level would be a huge breakout for the US Dollar.
Keep an eye on this chart. Money tends to run to the Dollar on a risk off environment and yes, it would impact gold.


Rising yields are seen as negative for gold. Yields have been declining as traders expect interest rates to fall.
I want to highlight though that yields have bounced at an important support level. Just keep an eye on this. This could lead to a rise in yield. The Fed has been a bit cautious by now stating there could be one rate cut this year. The markets and analysts were expecting 3 or more. We have also had some surprise inflation data from Canada and Australia. We do have the US PCE inflation report coming in tomorrow (Friday June 28th 2024), this will impact the current trajectory on the US Dollar.
In summary, there is a chance of the markets going into a risk off environment. Gold is showing the initial signs of a head and shoulders pattern. The market structure is there, but it requires a close below the support to trigger it. The US Dollar, and the current price action in bond yields, could mean some weakness ahead for Gold. But again, we will await for the breakdown to trigger this.
Happy Trading