
The last time I provided an update on the uranium charts was when uranium took out 2022 highs last year. Here are the charts to refresh your memories:

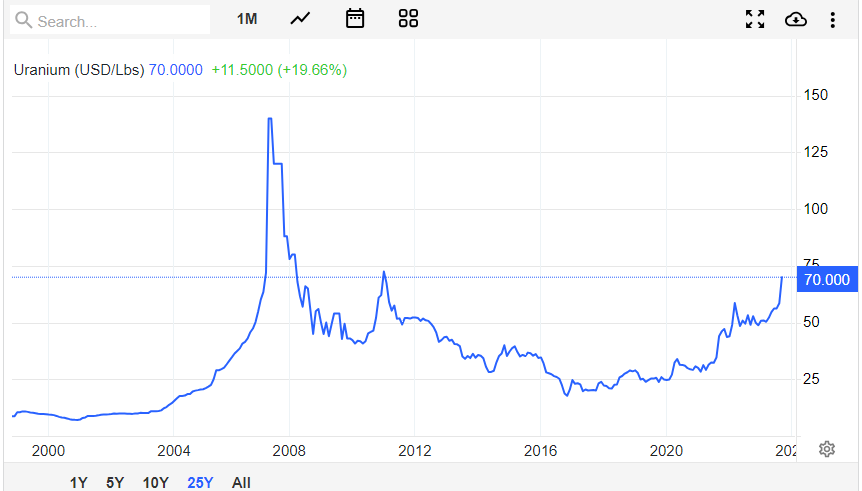
I put more emphasis on the second chart, the longer term chart, as a major resistance zone at $75 was to be tested. Pretty much the only resistance left until $100 (a major psychological level) and then previous all time highs at $140.
Just from a market structure perspective, the longer term chart shows a trend shift from a downtrend to a new uptrend after uranium ranged for a few years and created a bottoming pattern. Uranium is now making higher lows and higher highs, and according to market structure, the uptrend remains intact until the current higher low is taken out.
Let’s take a look at the chart of uranium now:
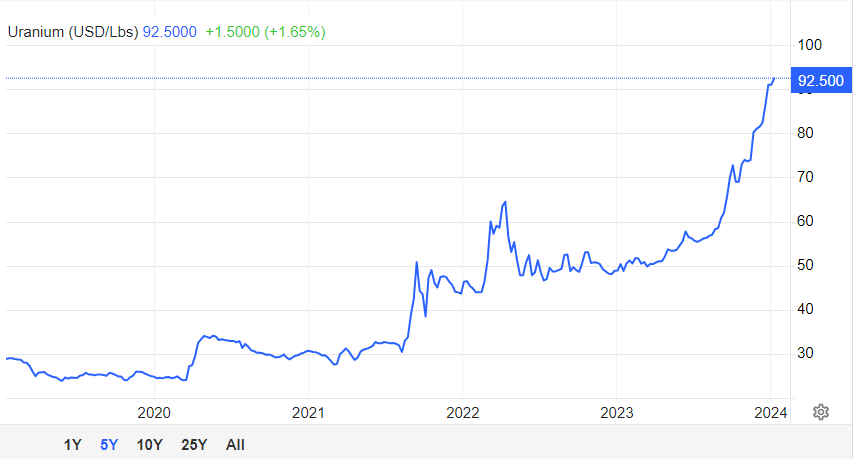
Parabolic.
From the weekly chart, we can say the current higher low comes in at $70. Meaning all is good for bulls as long as price holds above this zone. $100 is approaching and could provide resistance being a major psychological number.
But how about the fundamentals? Those who are bullish on uranium understand that nuclear energy is the best CO2 free source of reliable energy which can handle baseload power. The world is turning to nuclear energy to deal with the climate crisis.
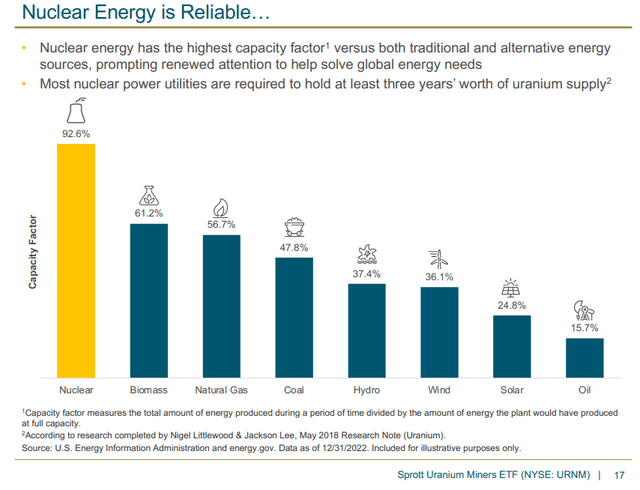
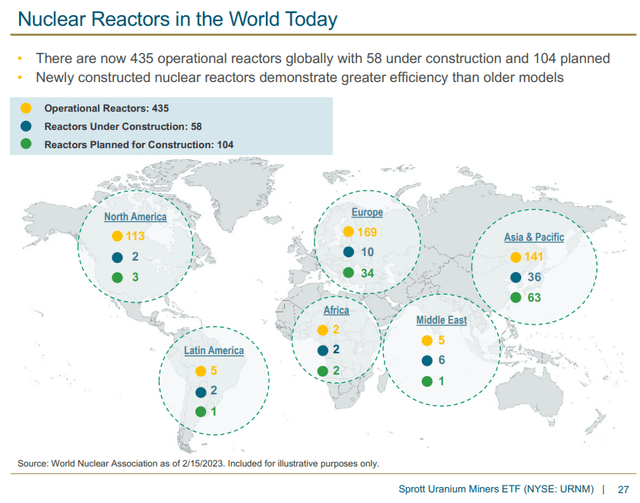
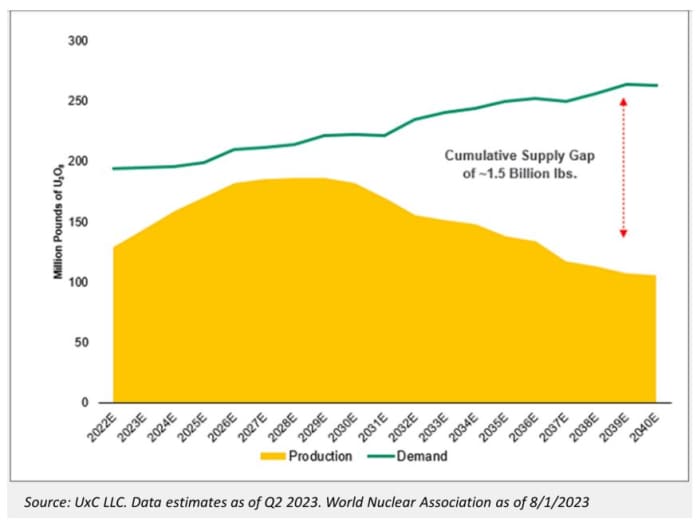
With more nuclear reactors being built and coming online, they will need some yellowcake. In simple economics terms: demand is high and supply is in deficit.
And let’s not forget that in Dubai at the 28th Conference of the Parties to the United Nations Framework Convention on Climate Change (COP28) 24 nations including the US, Japan, Canada, Britain, and France pledged to triple nuclear power capacity by 2050.
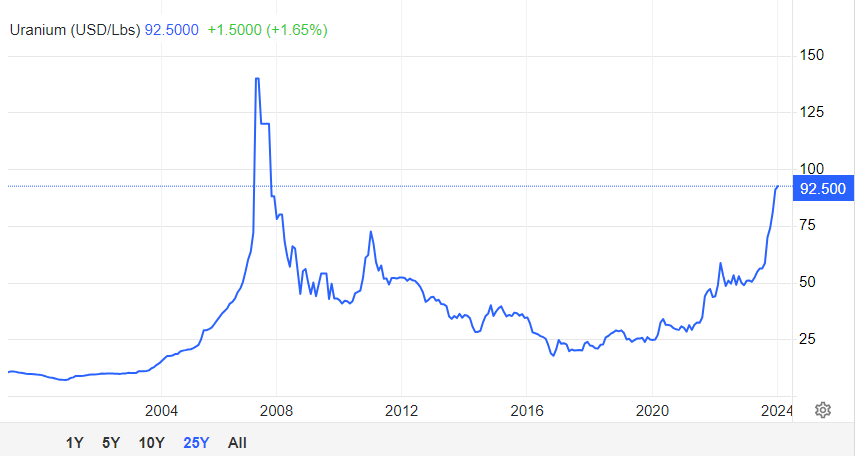
Trading Economics covers some of the recent country headlines which has caused quite the stir in the Uranium investing community:
Uranium prices rose above $92 per pound in January, extending the surge from late 2023 to the highest since late 2007, amid increasing signs of strong demand and risks to supply. Volatile fossil fuel prices and ambitious decarbonization goals drove the US and 20 other countries to announce that their nuclear power will be tripled by 2050. The large bets on nuclear energy are led by China, which is building 22 of 58 global reactors, while Japan restarted projects to increase nuclear power output, and a new reactor in Finland marked Europe’s first new facility in 16 years. Consequently, utilities signed contracts for 160 million pounds of U3O8 in 2023, the most since 2012. The developments were met with increasing threats to supply. Western utilities continued to voluntarily shun Russian uranium imports due to its invasion of Ukraine, while US officials moved closer to outright banning imports from the world’s top producer of nuclear fuel.
The largest uranium producer in the world, Kazatomprom, warned it is likely to fall short of output targets over the next two years. The uranium giant cited shortages of sulfuric acid (used to extract uranium from raw ore at a low cost) and construction delays at newly developed deposits as the main factors behind ongoing production challenges, which it said could persist into 2025. A detailed assessment of the potential impacts on output will be released in a trading update by Feb. 1.
“Despite the ongoing active search for alternative sources of sulfuric acid supply, current forecasts indicate that the company may find it difficult to achieve 90% production levels compared to subsoil use contract levels,” Kazatomprom said in the statement.
The price squeeze is on. Ole Hansen, head of commodity strategy at Saxo Bank had this to say:
“The uranium market is undergoing a major speculative investment rush with ETF’s holding physical stocks continuing to suck in stocks, thereby adding to the tightness being driven by the prospect of rising demand in the coming years, and a rush of buying of from utilities who have become lazy with hedging following years of low prices,”
Wall Street is also watching for the looming ban on Russian fuel services by the US with the Senate just a vote away from pushing it through. This would see some retaliation from the Russians with a ban on exports. However, this would see a nice move domestically for uranium miners and producers as the US would have to increase the domestic source and production of uranium.
A great time to be a uranium bull. Fundamentally and technically, uranium has everything going for it.
And how should investors play this bull market? Easy:
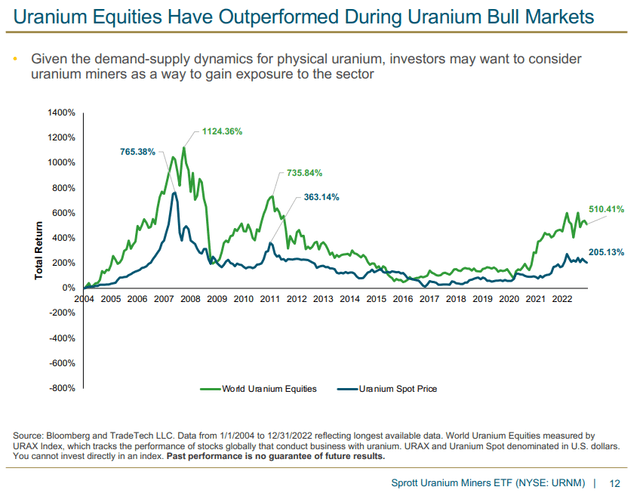
Uranium miners are the way to go, and for those extremely bullish, the juniors will provide some crazy percentage returns.

Canada’s largest uranium producer, Cameco, is an easy one. I had to zoom out on the monthly chart just to show you that Cameco is making new all time record highs.
Going forward, support comes in at the $63 zone.

Some may prefer a good mix of Uranium companies and thus would prefer the Global X Uranium ETF ticker URA. This has also broken out of 2021 highs and has a lot of room to the upside when it comes to technical levels.

My readers know that I have preferred playing uranium by holding the Sprott Physical Uranium Trust ticker U.UN. This ETF tracks the spot price of uranium. A major breakout over $20 and U.UN is set to test previous record highs.
In a recent article, Chris Parry mentioned some juniors making big moves:
A few days ago, Standard Uranium (STND.V) closed a private placement financing at $0.05. By Friday, their stock closed at $0.065, up 30% with volume building.
Over the last month, Azincourt Energy (AAZ.V) drifted back and forth between $0.025 and $0.03. By Friday, it hit $0.04 with massive volume eclipsed only once in the past year.
Over the last week, Skyharbour Resources (SYH.V) shifted from $0.44 to $0.55. On Friday it enjoyed a 10% stock price jump.
Three things about these companies:
- They’re all clients of ours
- They’re all tussling for elbow room in the uranium-rich Athabasca region of Saskatchewan
- They’re all run by guys who *will not stop* until they have achieved sector success, in Jon Bey, Alex Klenman, and Jordan Trimble respectively.
Let’s take a look at their charts.

Standard Uranium just confirmed a major breakout. It closed above a major trendline which has been acting as resistance. This is a breakout. The current selloff can be seen as a corrective move as price retests the breakout zone. If buyers step in to defend this trendline, then we are on our way to $0.10.

Azincourt Energy is in its range or consolidation phase. Meaning a trend shift is possible. A shift into a new uptrend. Watch for a close above $0.05 to get this one going.

Skyharbour Resources has had a strong bounce from support around the $0.45 zone back to a major resistance zone around $0.55. This is a very significant zone for the stock and you can see this by the price action to the left. If Skyharbour can confirm a close above this zone, then we have a major breakout. The $0.77 zone comes next.


