

It is now make or break for silver. The precious metal was on fire in the second half of August seeing five days of continuous rally followed by a few more green days taking the price briefly over $25. This zone turned out to be resistance and silver prices have given up those gains. We have just tested the lows of the second half August rally, and now silver is facing its moment of truth.
Before we delve into the silver chart and how I am going to trade it, let’s talk about a few fundamentals. Inflation has been ticking up as oil prices have climbed above $90 per barrel. We will hear from Jerome Powell on Wednesday September 20th 2023.
Currently the markets expect no change in rates:
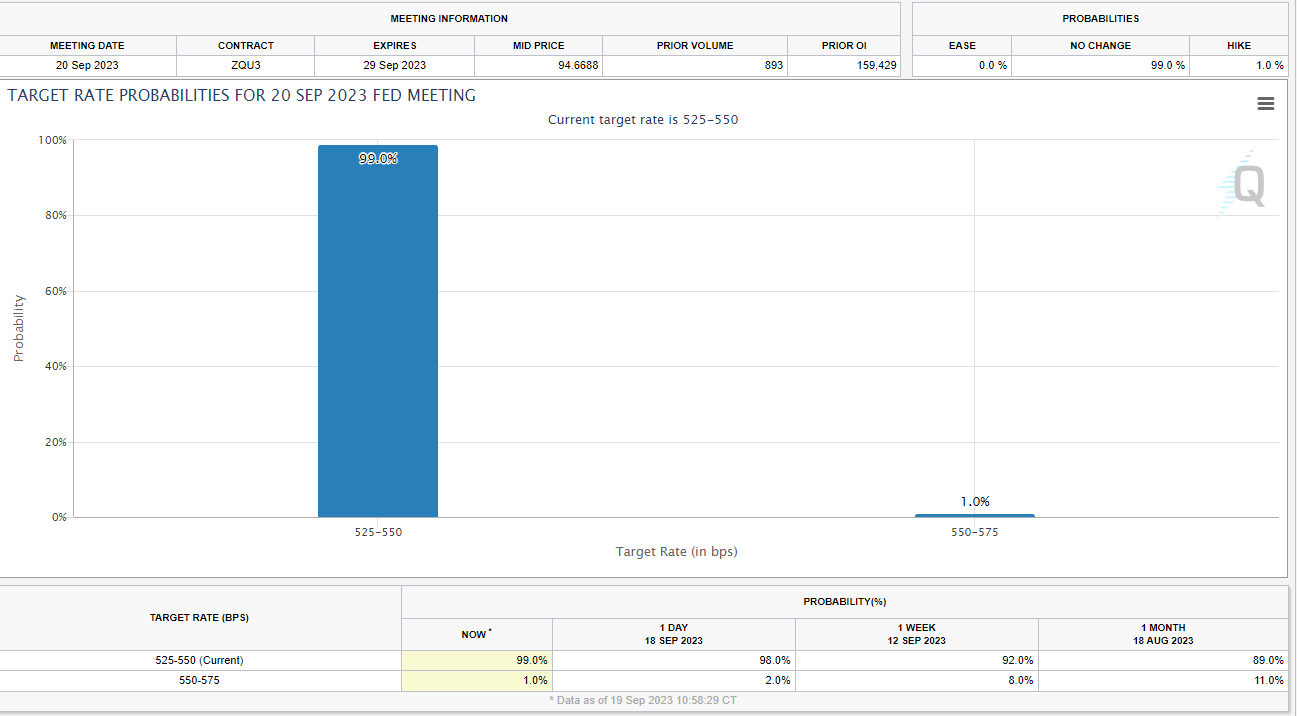
Central banks do not like to surprise markets so it is safe to say the Fed will not hike. If they did, then the markets would have to re-price things and since 99% of the market expects no change, a hike would cause volatility in the markets.
But what most investors and traders will be gauging is the trajectory of rates. The dot plot will be important, and just Powell’s tone. Will he remain hawkish stating that more rate hikes could be coming given the recent rise in oil prices and what this has done with inflation?
Two charts are providing evidence that the Fed might not be done:


Bond yields still remain strong. There is a real possibility yields can break out once again meaning a rise in interest rates. If investors thought the Fed was done hiking, then they would be buying bonds here. Remember the inverse relationship between bond price and bond yields. If bonds were being bought up, then yields would drop. But we are not seeing this. Perhaps this points to a hawkish Fed. Or perhaps there are other underlying issues with the US treasury markets. Maybe treasury’s are being dumped.

The US dollar is also near a key resistance point. After hitting 100, the DXY has been on a tear. The uptrend remains in play as long as DXY stays above 104.50. But a breakout could be in the cards depending on how the market reacts to the Fed. This would then put us on the path towards 110.
So a lot of important resistance zones are being tested on bond yields and the dollar. Both play a large part in determining where precious metals will go.
Since silver closely follows gold, let’s take a look at the gold chart first:

The price of gold remains constrained between our two trendlines. However, gold is also at a major make or break zone. Price has closed above the trendline but is now testing the $1940 resistance zone. If gold can confirm a strong daily close above this resistance, then the gold uptrend continues, with this range between the two trendline being just a corrective phase in an uptrend.
If gold can get this break, then silver will follow through. And now, let’s take a look at silver:

Starting off with the daily chart. Silver is also contained between two longer term trendlines. The recent rally briefly taking us over $25 actually rejected and reversed at this trendline. For silver to really get going, it will eventually have to close above this trendline with a strong daily candle. That will be the bullish trigger for a spike higher.
But I am more focused on the other trendline. The lower trendline which has been holding since 2022. On September 14th 2023, silver bounced at a major support zone ( a triple bottom as well!) which coincided with the lower trendline. It was a good area for a bounce. A bounce which could be turning into a dead cat bounce given recent price action. Of course the Fed could change all of this.
But silver is finding resistance at the current lower high level at $23.20. Yes, we did close above this zone, but the candle was not strong enough. This is why I always mention ‘strong’ candle breakouts. This is very important especially when you get closes like this that are just over resistance.
The real battle is taking place here, and if sellers pile in, then there is a real chance silver will not only retest the triple bottom support, but also break and close below the lower trendline which has been holding since 2022. If this were to happen, it would dampen any silver bullish momentum, and silver bulls would have to remain patient until silver displays promising bullish technicals.

The way I am playing this move is by going down to the 4 hour chart, but if you are trigger happy, you can go down to the 1 hour chart as well. As you can see, the 4 hour chart gives us a better lower high breakout. But the momentum is not holding, and an evening star candle pattern setup could be in play. I am not too surprised given we have a major fundamental high risk event tomorrow (the Fed).
Generally, I do not want to take positions before a major event because the volatility could cause stop losses to trigger etc. My preferred method is to wait for the event and then trade after the markets digest the data and when volatility settles down.
If this results in a 4 hour close above $23.40, this would trigger a long with a first target at $24.20. If it does not, then we would see this reflected in the daily chart indicating a rejection at the current lower high.