Last week, I told readers that uranium has triggered some bearish reversal patterns on the technicals. The follow through has been on point and there could be more lows for uranium coming. This will provide a great opportunity for long term bulls to add to their positions, or pick up other uranium stocks at cheaper prices.
Before I go further, I want to say that I am seeing a big drop in ALL energy markets. West Texas Oil has confirmed a major breakdown, so this move points to lower energy prices.

The technicals can tell us where markets are going in the short and medium term, and this is advantageous when looking to pick up (or let go!) of positions. But the fundamentals for uranium remain unchanged, which means bulls should take advantage of this move lower.
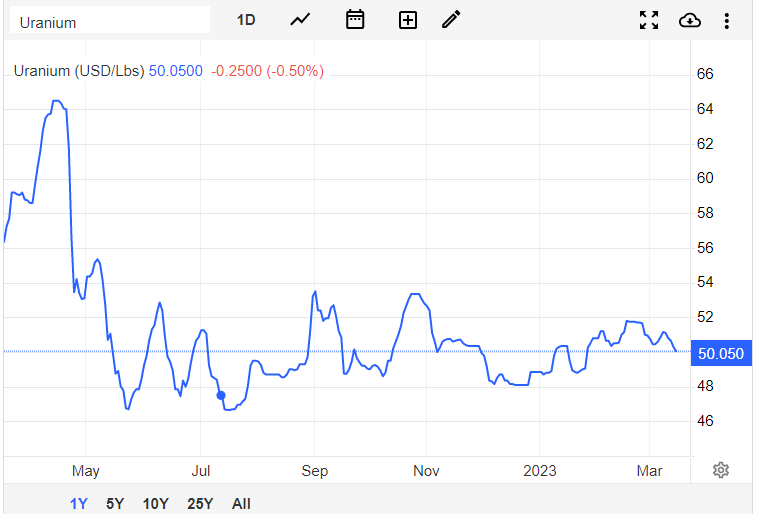
If we start off with the uranium futures chart, you can see we had a nice uptrend at the beginning of 2023. Recently, that uptrend has stalled, and a major reversal pattern is forming. I spy the head and shoulders pattern, and you can see uranium is shifting from higher lows and higher highs (an uptrend) to now lower highs and lower lows. Essentially a reversal and a downtrend is starting.
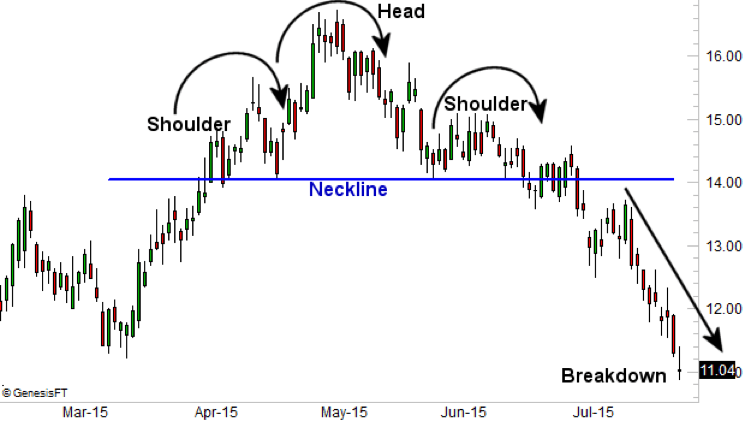
Judging by the line chart, the neckline is breaking which means this reversal pattern has triggered. The hope for bulls is that the pattern turns out to be a false breakdown or a bear trap, and we find buyers at the major $50 psychological support zone.
I spoke about the set up I was seeing on URA and U.UN. Played out as expected. Check out my video above. Let’s take a look at what we are working with now:

The Global X Uranium ETF (URA) has hit our first major support zone. We called the breakdown and retest at the $21.50 zone. Just beautiful and clean technicals. Now, we are testing a major support zone at $18. If we break down here, we would see 2022 lows be taken out. It would also signal more lows for uranium.
When would I turn bullish? It depends on if we can hold this support. Ideally, a long range indicating selling pressure has exhausted. But it still would not prove that a bull trap is playing out. To turn bullish, I would want to see a close back above $21.50.

I warned readers last week that a head and shoulders like pattern is forming on the Sprott Physical Uranium Trust (U.UN). It triggered and the retest of the neckline saw sellers jump in. We are approaching a major support level at $14.50.
To turn bullish, I would want to see a close back above the neckline at the $16.50 zone.
In summary, uranium prices are still in their downtrend and the technicals still indicate more lows are coming.
When it comes to news in the Athabasca Basin, not much has happened this week. We only got a major press release from Uranium Energy Corp.
Uranium Energy Corp (UEC)
Uranium Energy Corp filed its fiscal 2023 Q2 quarterly report. This can be seen on the SEC website or the companies website here.
The big news was the Company increased its total resources in Arizona for its Workman Creek Project. Combined with the Anderson Project, UEC now controls more than 32 million pounds of measured and indicated resources and about 4.5 million pounds of inferred resources.
Amir Adnani, President and CEO stated: “We are pleased with this update of the Company’s former NI-43 101 resources into fully compliant S-K 1300 resources for our Workman Creek Project. America’s uranium resources are becoming increasingly important for utility and government buyers looking for reliable supplies from stable U.S. jurisdictions. Combined with our Anderson Project, UEC now controls more than 32 million pounds of measured and indicated resources and about 4.5 million pounds of Inferred resources in Arizona, a mining friendly state and home to the Palo Verde Nuclear Plant, the largest power producer in the U.S. The Workman Creek and Anderson Projects provide UEC’s project pipeline with additional supply assurance for the longer-term requirements of utilities and the Federal government needs for U.S. unobligated uranium supply.”

Just like our ETFs, UEC is testing a key support zone. $3.00 is acting as support and a head and shoulders like pattern has also triggered. Will we bounce? Or likely, follow the same trajectory as the uranium ETFs and see a move lower.