A few weeks ago, I mentioned to readers that all energy markets were showing signs of major breakdowns. Uranium was included, and we called the move lower. In this uranium sector roundup, we will go over the charts before looking at Athabasca Basin based news.
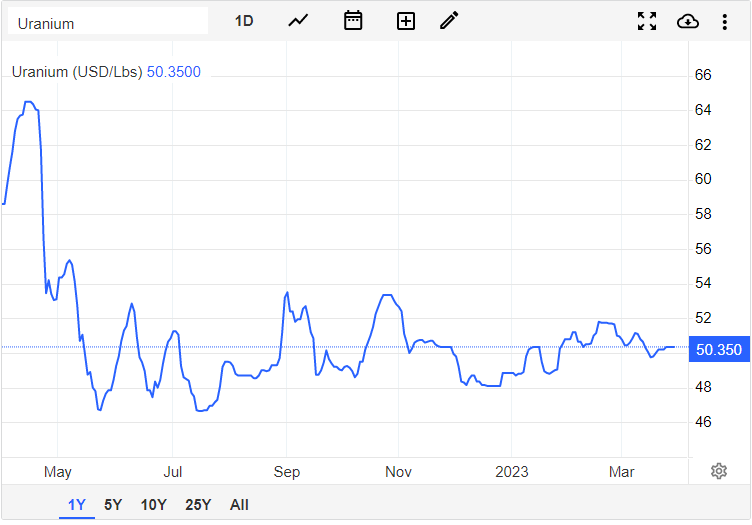
Let’s start with some positivity: uranium has recovered and is back over $50!
Now the kind of bad news. We have seen a bounce in energy which initially may feel like a reversal… However, these moves (including in the oil markets!) seem to be just a relief rally to retest the breakdown zones. Meaning that the downtrend is still in play unless energy markets can reclaim what was once recent support.
For uranium, this is occurring right now. The $50.35-40 zone is the neckline (or resistance/price ceiling) of the head and shoulders pattern I pointed out to readers. Here’s a quick reminder of how that pattern plays out:

You can see the same structure in the uranium chart, and as I mentioned, the neckline is currently being retested. If the downtrend remains intact, we should expect to see sellers pile in here and take uranium down lower. If uranium can close above the $50.35-40 zone then we can say that this head and shoulders reversal pattern has been nullified, which would lead to bullish price action. It is make or break now for uranium!
Let’s take a look at other uranium charts which could tell us where uranium is going.

The Sprott Physical Uranium Trust is what I like to use as my proxy for uranium price. You can see that the chart looks similar to the uranium line chart, and even has the similar head and shoulders pattern.
The neckline I have comes in higher around the $16.35 zone. This is the zone that needs to be taken out before we can flip back to being bullish. Currently, we are also testing my moving average. This is where I would expect to see sellers jump in.

The Global X Uranium ETF is showing something different. Something bullish.
This ETF hit the target I gave to readers around the $18 zone. You can see by some large wick candles that the buyers stepped in there AND we have triggered a double bottom pattern. We seem to be ready to trigger a breakout with a daily close above the $19.60 zone, with URA trading at $19.89 at time of writing.
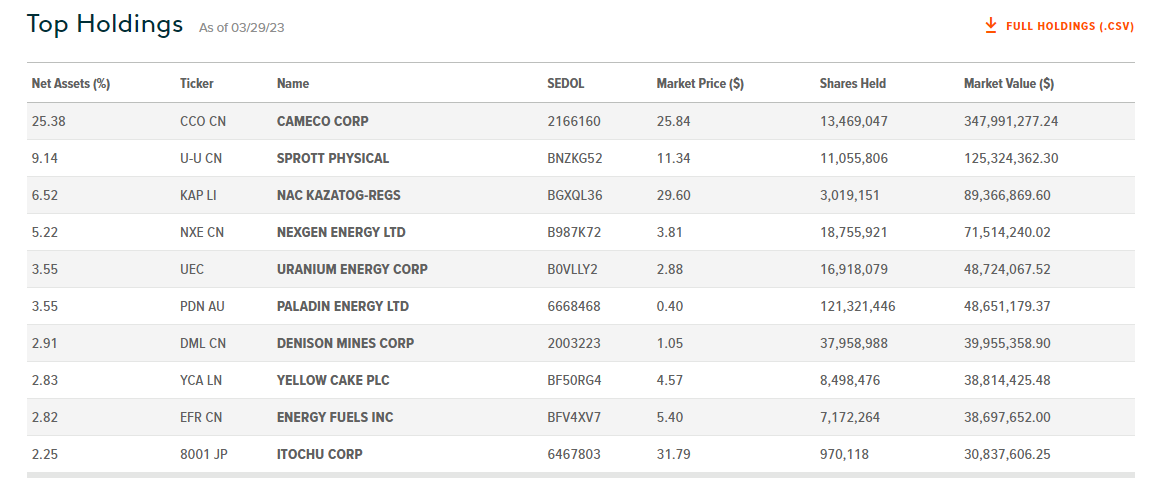
This would trigger the reversal pattern, and the next target would be $21.50. This means that the holdings of URA could see some positive price action. Holdings include:
CanAlaska Uranium (CVV.V)
CanAlaska Uranium this week announced the completion of a high-resolution airborne Versatile Time Domain Electromagnetic (VTEM Plus) survey on its 60% owned Geikie Project in the Athabasca Basin.

The purpose of the VTEM Plus survey was to identify basement conductors, characterize lithological and alteration variations, refine the structural setting, and prioritize drill targets for the Geikie project.
Preliminary survey results confirm the objectives have been met, with multiple target areas identified that consist of conductive anomalies associated with regional-scale fault structures.

The complete preliminary VTEM Plus data for the Geikie project, which still requires full processing and levelling, has been received. The initial preliminary data highlights a series of priority target areas that require further detailed investigation and modelling.
The primary target areas consist of a strong northeast trending conductor system, striking through the southern half of the property. A series of splays and offsets along this conductor are visible, often in correlation with intersections of regionally significant deep-seated north-south trending faults, interpreted to be part of the Tabbernor Fault System.
The secondary target areas include conductivity anomalies associated with prominent regional north-south trending faults, also interpreted to be part of the Tabbernor Fault System, that were previously delineated in the airborne magnetic and radiometric survey.
All preliminary data from the VTEM Plus survey has been received and final processed data is expected in Q2 2023. The Company will be undertaking subsequent modelling of the primary and secondary target areas that were identified, utilizing the final processed data, to generate a series of high priority drill targets.
CanAlaska CEO, Cory Belyk, comments, “Results from this airborne survey are very encouraging with multiple priority targets identified for drill testing. The CanAlaska and Basin Energy teams have developed a solid and measured approach for target development to provide maximum value to our shareholders on future drill programs. Every layer of new information added to Geikie supports and emphasizes its growing discovery potential.”

CanAlaska stock has actually climbed back above the support zone around $0.375. This is a positive step in a reversal. My moving average is being tested, and if we can break above it, CanAlaska could rally back to the $0.475 zone.
Azincourt Energy (AAZ.V)
Azincourt Enery (AAZ.V) announced it has completed the 2023 exploration program at the East Preston Uranium Project.
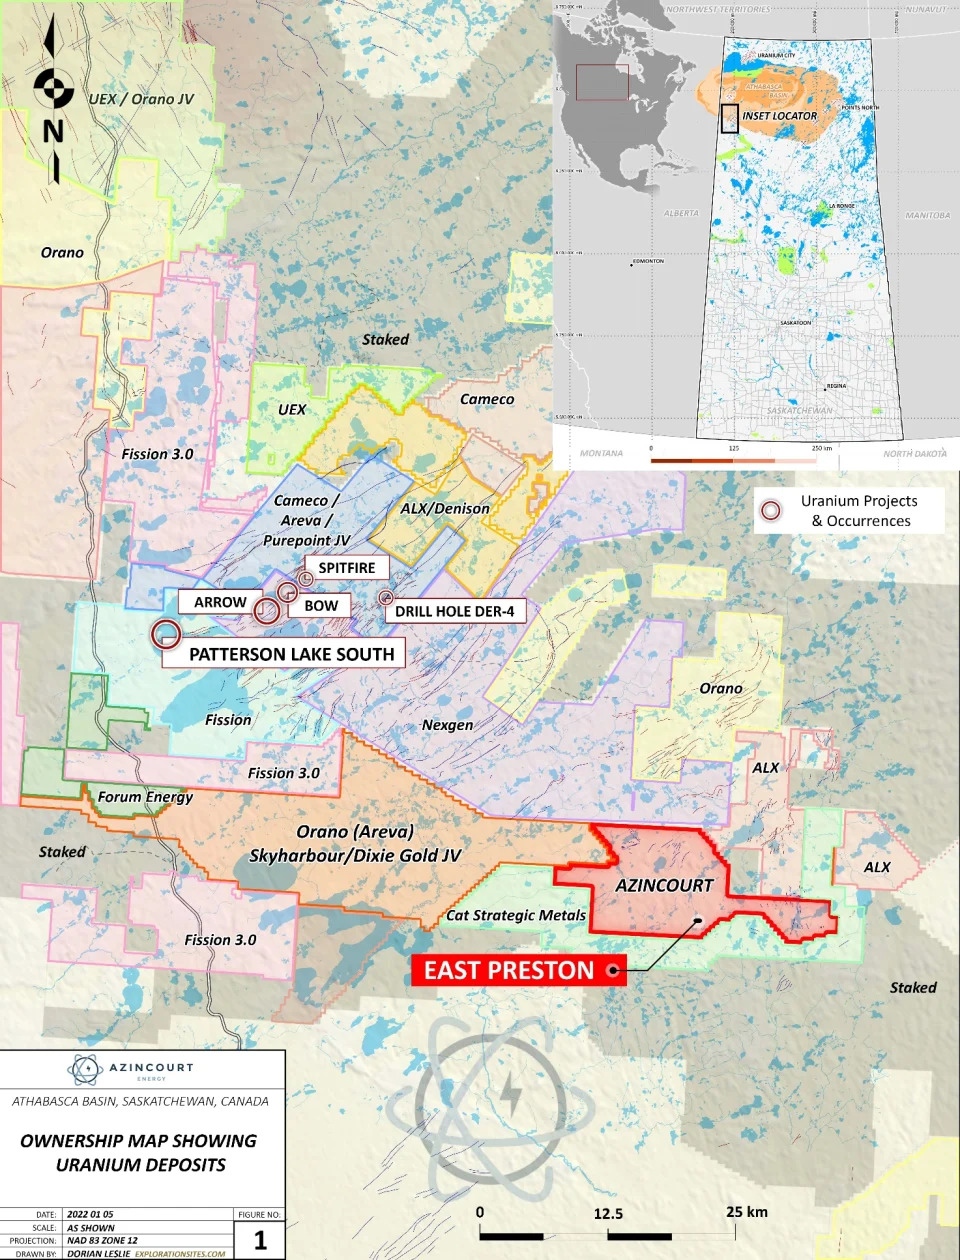
Drilling commenced on February 2nd 2023, and completed March 8th 2023. A total of 3,066 metres were completed in 13 drill holes. Two drill rigs were able to complete 12 drill holes and one abandoned due to drilling difficulties. Drilling was focused on the G, K, H, and Q zones with prior progress reported in a news release dated February 28th, 2023.

The priority of the drill program was to continue to evaluate the alteration zones and elevated uranium identified in the winter of 2022 with a focus on the G, K, H and Q Zones.
The company considers the drilling results to date to be significant, as major uranium discoveries in the Athabasca Basin such as McArthur River, Key Lake, and Millennium were primarily the result of drill testing of strong alteration zones related to conductor features. Identifying and upgrading the strong alteration zones is a significant step forward in identifying the key areas along the conductor trends where more attention is required.
“The alteration we are seeing in the K and H Zones is very encouraging” said VP, Exploration, Trevor Perkins. “This and previous programs have shown that we have a significant alteration system present on the property. Finding the extents of this system and identifying where within that system the alteration fluids are focusing remains a top priority. The identification of dravite and illite clays emphasizes that we are on the right track and getting very close,” continued Mr. Perkins.
“We’re very pleased with the results of this year’s program so far,” said president and CEO, Alex Klenman. “Intersecting dravite and other clays, after the discovery of hematite alteration last winter, matches the very exploration model we’re following. This is what we wanted to see and needed to see. This is a very positive development and we’re excited to see the lab results.
A total of 687 samples were collected throughout the program and sent to the Geoanalytical Laboratory at the Saskatchewan Research Council in Saskatoon, Saskatchewan for analysis. Results are expected to start arriving in May.

The stock has recently broken down and retested previous all time lows tested in 2020 hitting $0.04. In doing so, we have broken below this support which has been holding since 2022 at $0.045. Bulls would want to see a strong close back above this support level to confirm a false breakdown. The fundamental catalyst which could see momentum carry through would be drill results expected in May 2023.
F3 Uranium (FUU.V)
F3 Uranium Corp (FUU.V) is a uranium project generator which is identifying highly prospective projects in the “Saudi Arabia of Uranium” the Athabasca Basin. Home to the highest uranium grades in the world, F3 Uranium currently has 16 properties here.
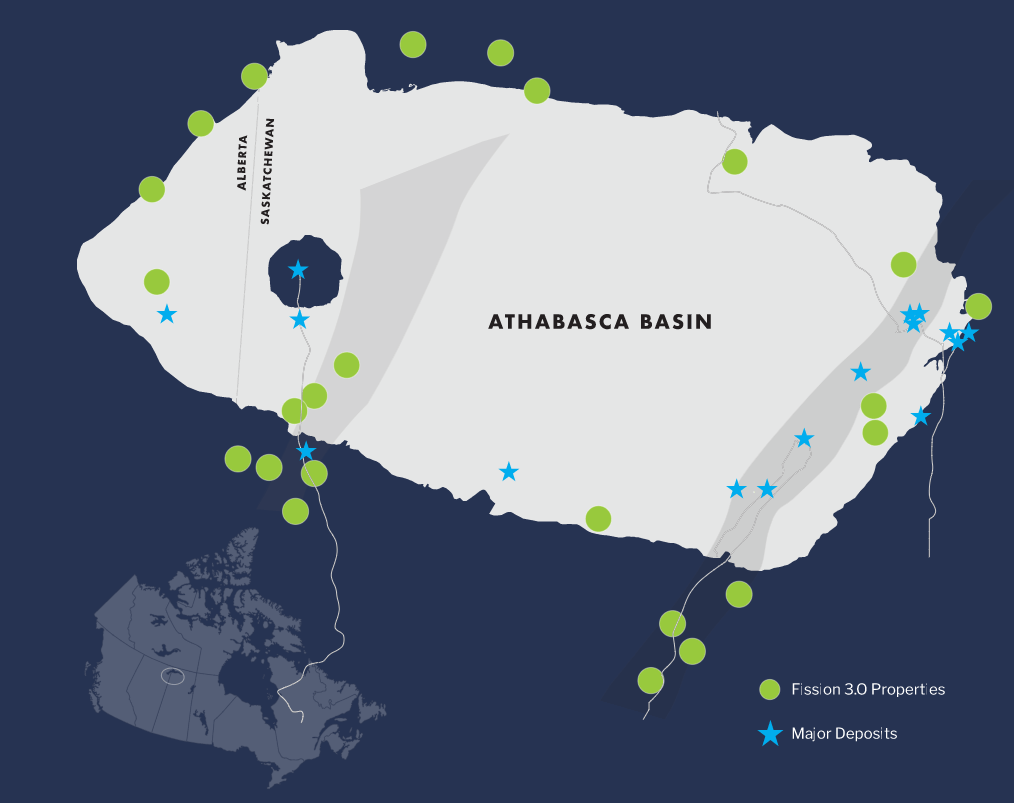
The Company made headlines in November 2022 when it announced a new uranium discovery at its 100% owned Patterson Lake North Project located just within the south-western edge of the Athabasca Basin in proximity to Fission Uranium’s Triple R and NexGen Energy’s Arrow high-grade uranium deposits. Since then, the discovery play has been in play when it comes to the stock chart.
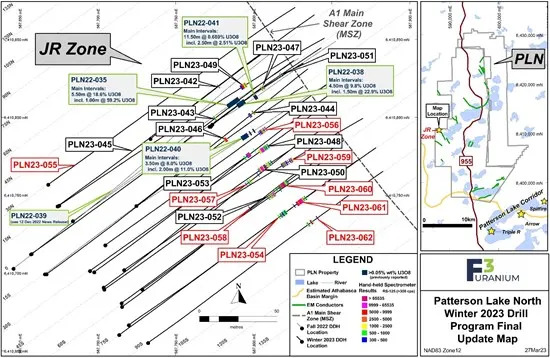
This week, F3 Uranium announced scintillometer results from the final nine holes of the winter drill program at the JR Zone on the Patterson Lake North (“PLN”) Property, including five high grade intercepts.
Here are the highlights:
PLN23-060
- 17.5m composite mineralization from 231.5m – 253.5m, including
- 4.98m composite mineralization of >10,000 cps between 243.17m – 252.83m, further including 3.82m of continuous off-scale (>65,535 cps) radioactivity from 244.00m – 247.82m
PLN23-054 (line 075S):
- 14.5m composite mineralization from 244.0m – 269.0m with a peak radioactivity of 6,600 cps from 248.5m – 249.0m
PLN23-056 (line 030S):
- 11.5m composite mineralization from 237.5m – 249.0m, including
- 1.34m continuous mineralization of >10,000 cps radioactivity between 247.16m – 248.50m with a peak of 32,300 cps
PLN23-057 (line 045S):
- 7.0m composite mineralization from 246.0m – 268.5m with a peak radioactivity of 1,400 cps from 252.0m – 252.5m
PLN23-058 (line 060S):
- 1.0 m continuous mineralization from 253.0m – 254.0m with a peak radioactivity of 360 cps
PLN23-059 (line 045S):
- 17.0m composite mineralization from 238.5m – 255.5m, including
- 1.32m composite mineralization of >10,000 cps radioactivity between 243.18m – 254.00m with a peak radioactivity of 31,100 cps
PLN23-061 (line 075S):
- 14.0m composite mineralization from 246.0m – 260.0m, including
- 5.08m composite mineralization of >10,000 cps radioactivity between 246.71m – 254.93m, further including 2.81m of composite off-scale (>65,535 cps) radioactivity
PLN23-062 (line 090S):
- 6.0m composite mineralization from 240.5m – 256.5m, including
- 1.0m continuous off-scale (>65,535 cps) radioactivity between 246.5m – 247.5m
Drill hole PLN23-060 collared on line 060S has intersected the strongest radioactivity to date at the JR Zone. It intersected radioactivity over 17.5m, including 3.82m of continuous off-scale radioactivity >65,535 cps between 244.0m and 247.82m.
Raymond Ashley, Vice President Exploration, commented:
“With the final nine holes of the winter 2023 drill program the technical team is delighted to announce the strongest off-scale radioactivity drilled so far at the JR Zone with infill hole PLN23-060 on line 060S, making it the best hole to date. Moreover, the two holes which have expanded the JR Zone to a current length of 105m both intersected off-scale radioactivity >65,535 cps, hole PLN23-061 which stepped out to line 075S and hole PLN23-62 which stepped out further to line 090S. Additional holes will be planned for the summer program on section 30N as the single hole drilled on that section, PLN23-055, did not intersect mineralization. This is a fantastic ending to a very successful winter program of growing the JR Zone along strike towards the south within the A1 main shear zone, following the direction in which strong continuity of high grade mineralization had been established earlier in the drill program.”

The price action remains contained within our support and resistance. Support comes in at $0.30, while resistance comes in at $0.50. The stock has been ranging between these two levels since late December 2022, after the stock made a huge rally on the new discovery news. Traders await the breakout, but this is a stock that has an exciting discovery fundamental catalyst!