Many of us have been watching oil prices, but natural gas prices are also about to add to inflationary pressures as cold weather approaches and people turn the heat to warm their homes.
The respite has been warmer than usual October weather. It really helped Europe most of all as a fall in natural gas prices allowed many nation’s to fill their gas storage in preparation for colder weather.
Seasonality applies to natural gas. We expect it to be higher during colder months, and lower during the warmer months. Seasonality, along with supply and demand, is causing natural gas to spike. We are currently up over 10% at time of writing:

The Wall Street Journal is attributing this rise on forecasts for a sharp turn in cold weather starting next week. Cold weather means that daily heating demand is expected to double between Thursday and Sunday as temperatures shift from unseasonably warm in the eastern U.S. to colder than normal across the entire country.
In Europe the situation is different. Weaning off of cheap Russian gas means Europe will need to import LNG. Currently, more than 30 tankers carrying $2 billion worth of LNG are idling off Europe’s coast as gas terminals are full. Tankers have an incentive to idle as traders expect gas prices to rise.
As of November 2 2022, gas storage sites in Europe were 95% full, with German storage at 99.3% full, according to data from Gas Infrastructure Europe.
Traders are speculating on how fast storage levels could be depleted this Winter, and if demand from Asia will divert or increase the competition for LNG supply in Europe. Will Europe have enough energy this Winter? This is the $1 million dollar question.

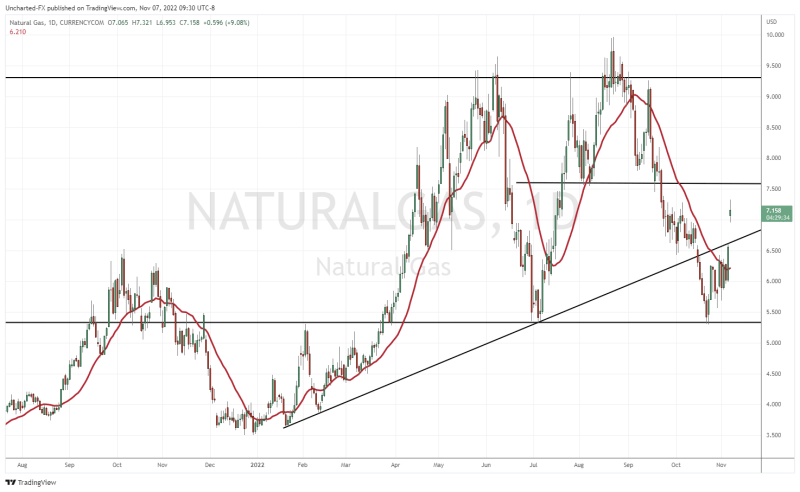
On the technicals, natural gas has bounced from support at $5.35, and is about to confirm an important close. Notice the trendline I have drawn out. When natural gas broke below $6.50, it was a major technical break as a significant uptrend line was taken out.
My strategy looks for basing patterns, and Friday’s candle close above my moving average was technically a trigger. My only reservation was we were retesting the trendline, and naturally, I was expecting sellers to return.
But then cold weather forecasts was the catalysts to change the trend. Now, we have failed to confirm a retest of the trendline. We are now bullish.
I do have one more resistance level ahead at the $7.60 zone. This was the neckline of the head and shoulders pattern which triggered back on September 22nd 2022. And this is a neckline which has not seen a retest since the breakdown. It appears as if we will get that retest now. However, with the fundamentals of seasonality and colder weather and potential supply shortages, we have the catalysts to climb above $7.60 and reverse trend.
Can’t trade CFDs or futures? No worries. This ETF in Canada is very bullish:

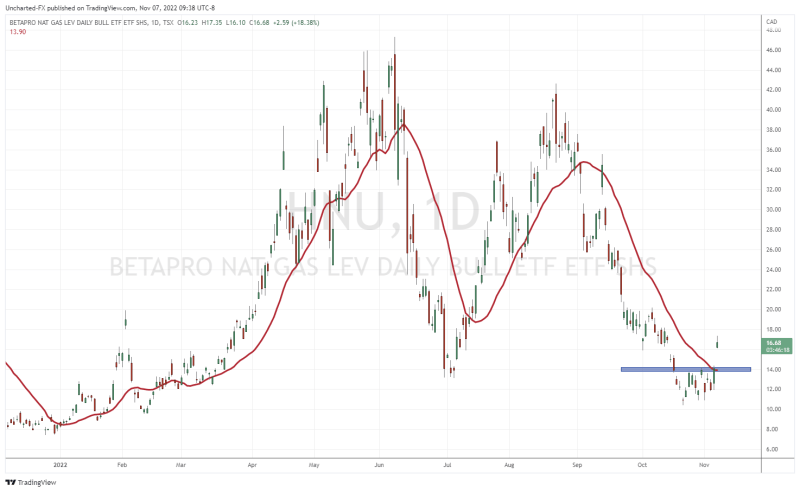
HNU, the natural gas leveraged bull ETF is showing reversal signs. We have a downtrend, we then had our range, and today’s price action will confirm a breakout. A possible pullback to $14.00 is possible, but as long as HNU remains above $14.00, more higher lows are coming. $20 is the next resistance zone to target as a swing trade.
Currently, HNU is up over 18% for the day.

