
Precious metals and most other commodities have been getting smashed ever since Jerome Powell made it clear that more rate hikes are coming. Markets and traders just got a wake up call to this fact with August CPI inflation coming in hot. An aggressive Fed with more rate hikes is coming.
This also means that the reserve currency has been strong. The US dollar strength has been weighing in on many assets. Especially on gold and silver with gold being negatively correlated with the US dollar.
Silver has taken quite the fall. A fall that we have expected, but the white metal is on the verge of breaking down further. A fall which would see silver prices fall below the production costs of most miners.
But don’t worry silver bulls. Things can still happen on the chart in the next few trading days which could shift the technicals. Instead of breakdown, we could be talking about basing and silver beginning a new uptrend here. Certain criteria must first be met.
I just covered the fundamentals and technicals on gold. The same things can be applied to silver. There is one more major difference though. Silver is primarily seen by many as an industrial metal. Even though silver correlates more with gold (the precious metal) than copper (the base metal) silver is used for industrial purposes and not primarily seen as just money. Personally, I just see this as a bonus for holding silver in the long term. You get the best of both worlds. The world will need more silver for going green as it is needed for solar panels and wind turbines. In the future, I see a silver market where there is high demand but not enough supply. But for now, recessionary fears are putting pressure on silver and other industrial metals.
Other reasons to be bullish silver? It has to do with the movement of gold. I have said in the past that gold goes up when there is a confidence crisis. When people begin to lose confidence in the government, in central banks and the fiat currency, money runs into gold. Gold has been money for thousands of years, and it doesn’t matter what happens to a country, be it war or a new regime, gold continues to be money in the new order.
Looking around the world, I see many reasons why the theme should be wealth preservation. Geopolitics, inflation, the energy situation in Europe which will start making headlines in a few months, agriculture and drought, central banks breaking the system with rate hikes, a largely indebted consumer and middle class. The list goes on and on. The argument is that money will run into the US dollar, but I think there will be an issue with this. The Dollar will get too strong that it will break things. We are already seeing the effects of a stronger dollar with the Turkish Lira, the Japanese Yen and possibly the Hong Kong Dollar soon. Let’s not forget the Euro and the British Pound as well!
If the dollar gets too strong, what will the rest of the world do? Especially those emerging markets with large dollar denominated debt. Debt that just got a whole lot expensive with the rising dollar. Bretton Woods/ Plaza Accord 2.0 anyone? The Fed and the US may be forced to devalue the dollar as a stronger dollar wreaks havoc, but this is something that isn’t going to happen tomorrow. This is just what I see playing out long term. For more details on this and the Dollar milkshake, check out my recent gold piece.
Not only do I see money running into gold when things ‘break’, but I see funds moving into silver as well. The move in silver has the potential to be explosive given the smaller size of the silver market compared to gold.
I do want to highlight the inflation topic again since it is literally making financial headlines. Currently, the financial media and even central banks are spinning that inflation is hot due to war and supply chain issues. Nobody really asks what rate hikes will do to alleviate those issues. If you look up the definition of inflation, it is always about printing money. The truth is governments have printed a ton of money and we are in a situation where there is more money in the system competing for the same number of goods and services. This excess money must be removed from the system. Ironically, the inflation reduction bill passed in the US is likely to increase inflationary pressures rather than reduce them.
What about central banks you say? Here’s the thing, central banks haven’t really been printing excess money. Back in 2012, the Federal Reserve did something called operation twist where they bought bonds on the long end of the curve (increasing money supply) but then sold off the short end (removing excess money). With the pandemic, the Federal Reserve did something called Reverse Repo. Essentially, the central bank bought bonds (increasing money supply) but immediately borrowed the money they just gave to the banks (reduced the money supply). The money supply just with the interest payments the Fed makes to the banks. Government and their spending policies are the real culprit.
Now let’s take a look at some charts!

Starting off with the US dollar (and some hope for silver bulls!). The dollar recently broke out of a triangle pattern taking out 106. DXY has rallied all the way up to the 110 level. We saw some resistance here and the dollar initially sold off. We struggled to make new highs which was a good thing for precious metal bulls.
There is a possibility that the US dollar sells off here. The big question though is will this sell off be a new reversal, or just a pullback in the uptrend. The first case would be positive for gold and silver. The second case would provide some relief for precious metals but then mean we break below our important support level.
Now we have the major fundamental news. Inflation came in hot and the markets are pricing in more rate hikes from an aggressive/hawkish Fed. The Dollar had a strong day on the market readjusting its sentiment. If we see the dollar close above 110, then the strong dollar uptrend continues. If we struggle, the dollar could print some sort of double top pattern which would be a bearish signal.
But for me to go completely bearish on the US dollar, I need to see a break below 105. I believe a break below 108 would just be a pullback in the uptrend.
Silver time.
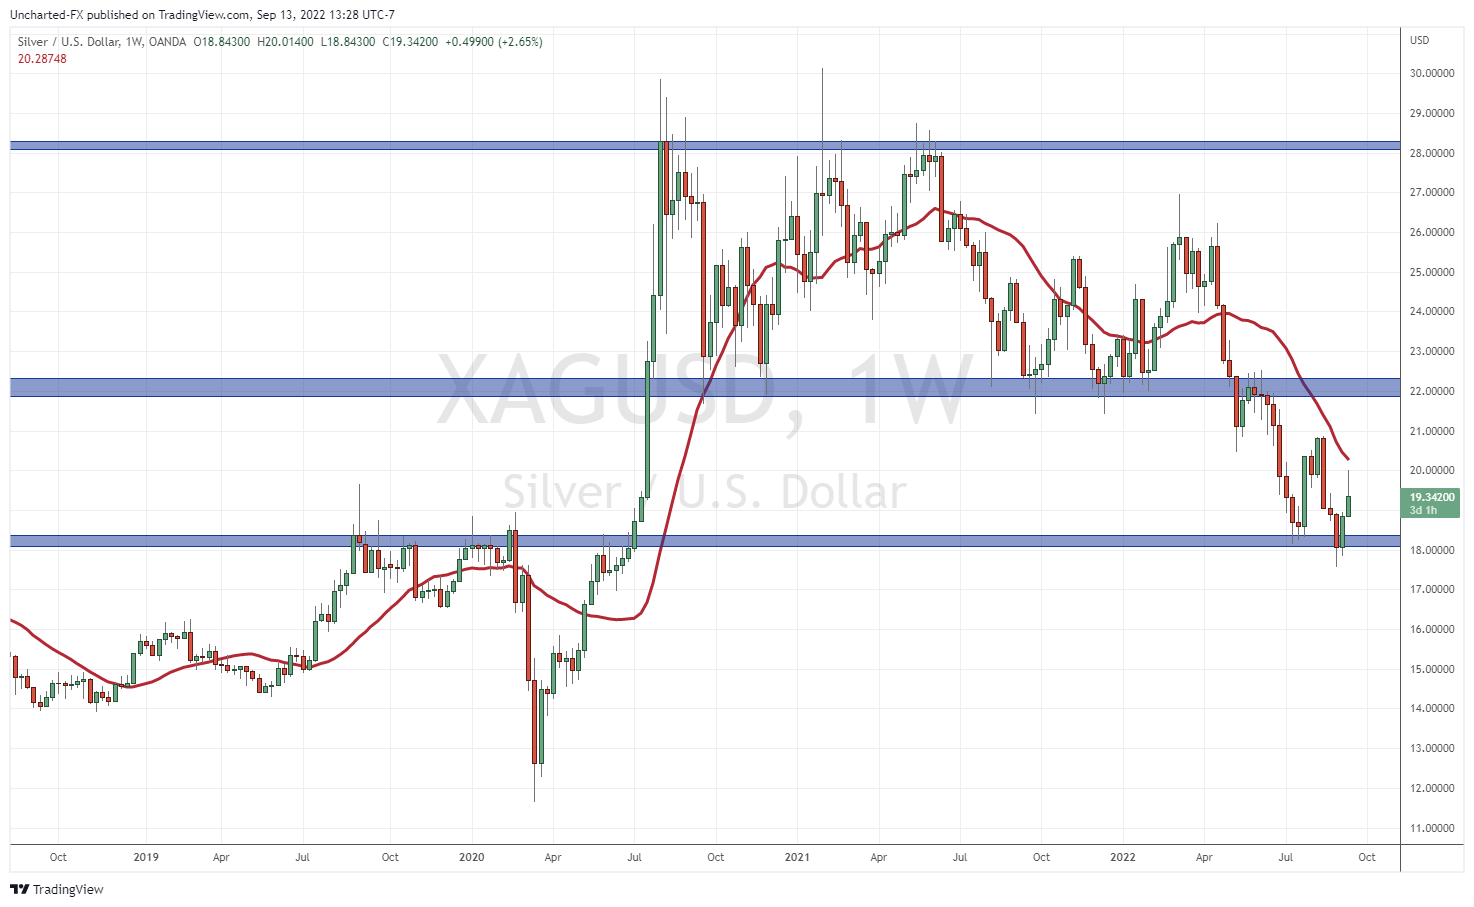
The chart above is the long term weekly timeframe. Each candle that you see represents one full week of trading price action.
Back in May, I warned readers that a breakdown is triggering on silver. My target to the downside? $18. Just simple technical levels utilizing support and resistance or price floor and price ceiling.
Now a few months after that call, I am here to tell readers that another breakdown is possible. If silver closes below $18 on the weekly timeframe, we have another breakdown. If this happens, the next major support level comes in at either $16 or $15.
What is the criteria for a breakdown? A weekly close means that at the end of the trading week on Friday, we will take a look at the silver weekly chart and see if silver closed above $18.
If silver does not break down here, then we could be setting up for a reversal. A lot of this depends on that US Dollar chart.

If I go to the daily chart, where each candle represents a single day of trading, you can see how important this current support level is. You can also see that on the daily, we actually did close below this level. Yikes. But fortunately the break turned out to be a false breakdown as bulls reclaimed the $18 zone. If we did not, then our weekly confirmation close would have been triggered.
Nothing is confirmed until that weekly close.
To the left of the chart, you can see what happened to silver the last time we tested $18. Back in late July 2022, we bounced right at this support. This is what bulls ideally wanted to see, and perhaps what they will see. I must say, I initially liked the price action silver had on August 12th. We had a monster 5% rally. Unfortunately there was no follow through with the inflation data.
Now we are at a pivotal area on the daily chart. The $19.25 zone was the previous lower high. Essentially, as long as silver remained below this level, the downtrend was going to continue. We have taken out this lower high which is a bullish sign. But can we hold it after the inflation data? If we slice right through it then we will be heading back to $18 and likely lower.
There is a chance the dollar spikes again but fails to take out recent highs. This would translate to silver dropping to $18 but then bouncing from there. It might take silver bulls on a roller coaster ride, but it would set us up for a double bottom pattern… just as the dollar prints a double top pattern.
Stay positive silver bulls and keep on stacking!