
Have US stock markets bottomed? From a technical analysis perspective: yes, there is a very good chance they have. From a fundamental perspective: it gets complicated.
If we consider fundamentals, there is a lot which can weigh in on markets. Some things to consider are: Earnings, China, Russia, Inflation, Interest Rates, Supply Chain Issues, European Energy Crisis, China Real Estate, Covid Cases Rising etc.
As horrible as this may sound, bad news might actually be good news for the stock markets. It all comes down to making yield.
Right now, some major banks are stating that the markets are now pricing in a 100% risk of a US recession before the year’s end. In fact, the US may officially be in a recession by the end of next week. We get US Q2 GDP data on July 28th 2022… the day AFTER the Federal Reserve interest rate decision. The key question for investors going forward is if markets have indeed priced in a recession.
Why would markets act positively to a recession? It would mean the end of the Federal Reserve interest rate cycle. Generally, when there is a recession central banks begin to cut interest rates as a way to spur the economy. If interest rates fall, then stocks once more become the best place to go for yield. There are many making the argument that with higher interest rates, money will flow back into bonds. This is important as many funds and money managers follow the asset allocation model of stocks/bonds.
However we need to talk about inflation. Yes, bonds right now are yielding around 3%, but if you factor in inflation then in real terms, you are still losing money holding bonds. We might go into a crazy scenario where the economy is slowing down but inflation continues to rise. A situation known as stagflation.
The cure? Well there is none according to Investopedia:
There is no definitive cure for stagflation. The consensus among economists is that productivity has to be increased to the point where it would lead to higher growth without additional inflation. This would then allow for the tightening of monetary policy to rein in the inflation component of stagflation (that is easier said than done, so the key to preventing stagflation is to be extremely proactive in avoiding it).
When I read the line that says productivity has to be increased, I automatically think of government spending. Governments will have to spend big to try and increase productivity. This means more money printing at a time when interest rates are high. It doesn’t look too good but this will be a story for another time.
It should be noted that during inflationary times, stock markets tend to perform well. Once again, it goes back to the idea of making yield. If inflation is coming in hot, then you need to make a certain return on your money that beats this inflation. Gains like this are found in the stock market.
There’s a lot to process when it comes to fundamentals but I like to bring it down to central banks. I mean their policies of keeping interest rates artificially low after 2011 is what caused the everything bubble. Central banks will make or break these markets. The other issues I listed could be seen as black swan events. Something the markets have not priced in yet, and would obviously take the markets by surprise.
Many of you know my specialty lies in technical analysis. Recently, global markets are showing signs of a reversal indicating that this may be the bottom of this bear market. In fact, many European indices have confirmed the trigger breakouts while US markets have not. Perhaps a telling sign that US stock markets will follow.
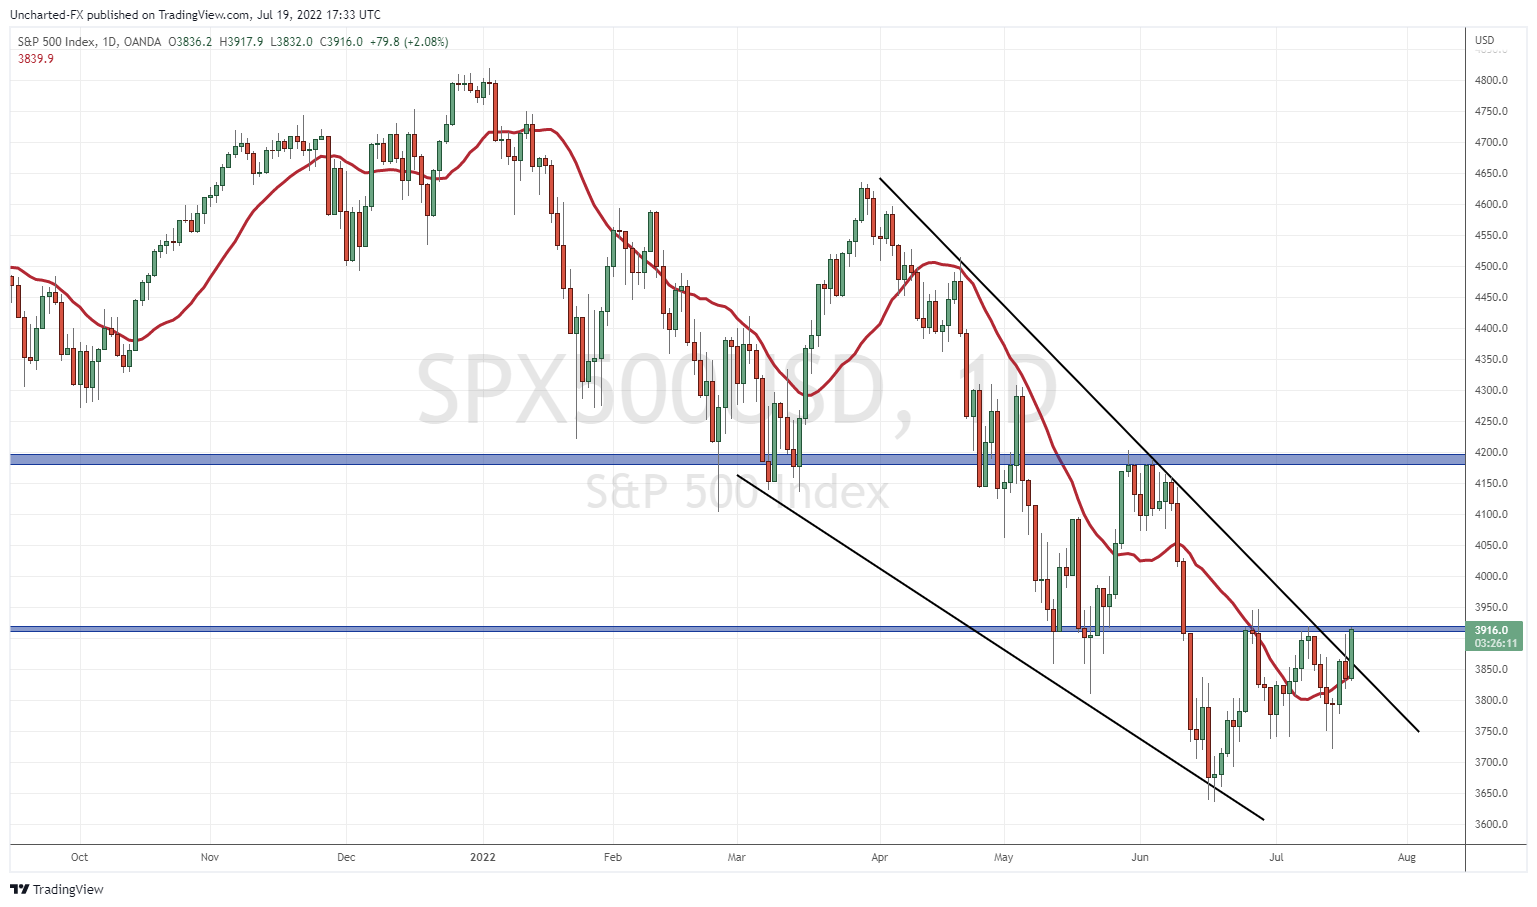
And we are very close to following. US stock markets have been in a range and are just waiting for the breakout. The chart of the S&P 500 above is just one step away from confirming a breakout and potential reversal. We need a close above this resistance at 3920 to go long. My trendline break is also indicating the downtrend is coming to an end.
Volume is often a strong indicator of a reversal when paired with a technical breakout. Volume has indeed been increasing lately but Summer months tend to see lower volume. I would make it a priority to see the volume profile if these US markets breakout.
I say if because we could see a rejection at 3920 and continue to hold this range. It has already happened three times since June. However, with European equities reversing, there is a good chance US equities follow along.
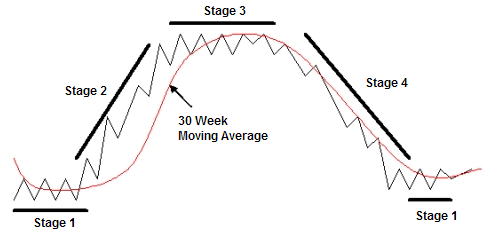
People know I love my market structure, and indeed we are in the range portion after a downtrend on US stock markets. Referring to the image above, stage 4 is about to end and markets are currently in stage 1. A breakout triggers stage 2, or an uptrend. Things are looking very positive from a technical analysis perspective!
To end off, let me show you the charts of the Nasdaq, the Dow Jones and the Russell 2000.
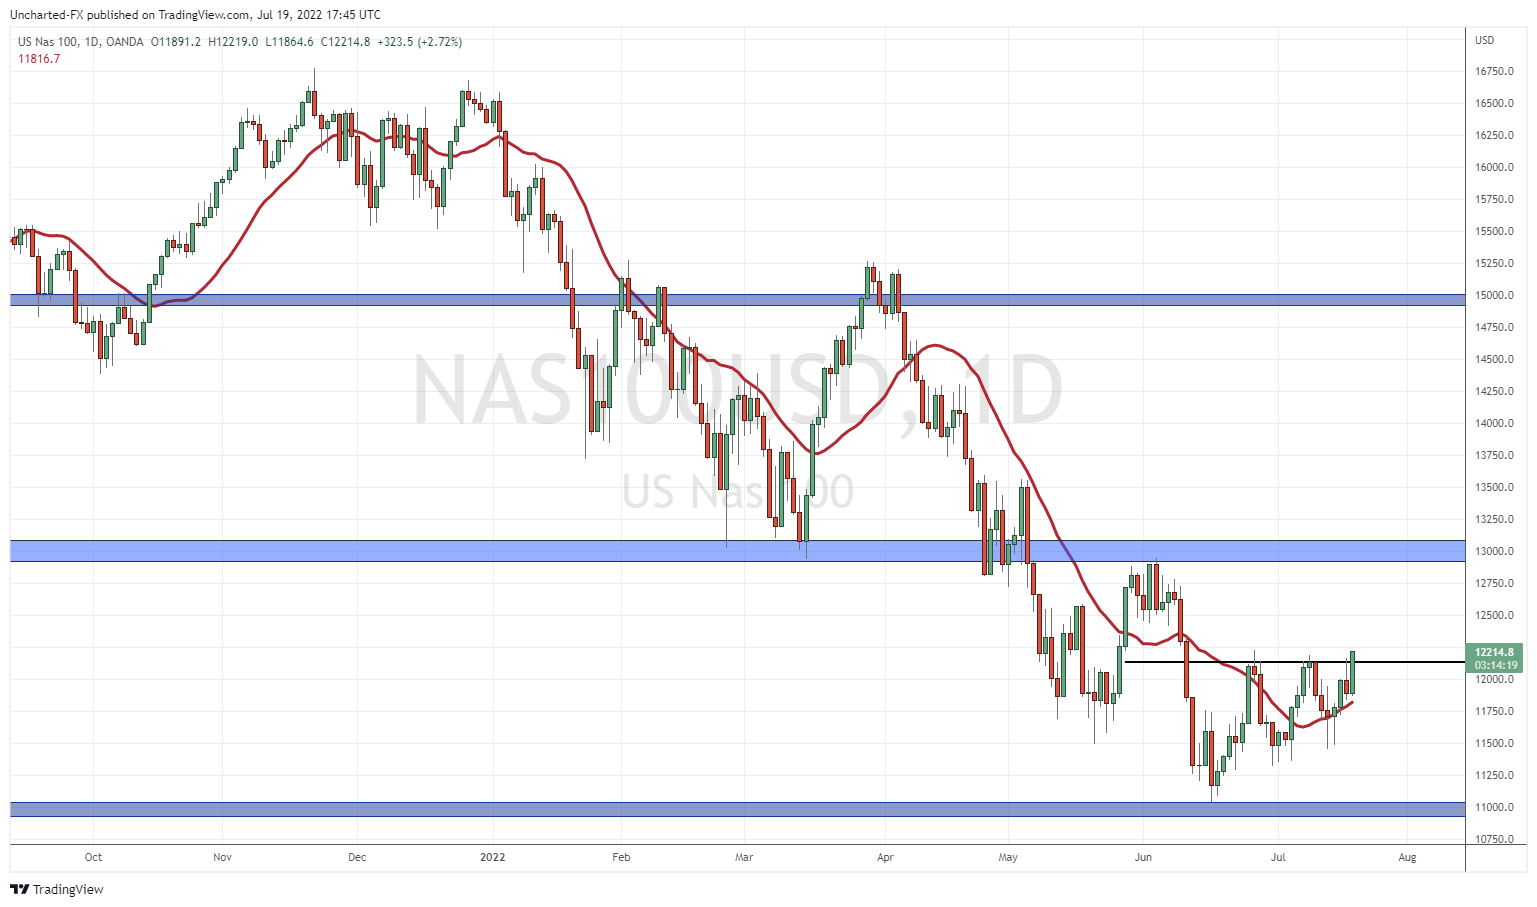


The structure is the same. All of these markets are looking likely to confirm a daily candle close breakout and trigger a new uptrend.
Next week we have a lot of US related events which will affect stock markets. I am referring to the Fed rate decision on July 27th and the US Q2 GDP data on July 28th. It is likely those events are priced into markets, but if there is some major surprise, the markets could react in a volatile manner. It comes down to whether these surprises will sustain the breakout momentum, or stop it dead in its tracks.
As a technical analyst, I can tell you that markets are showing very positive signs of a reversal. The breakout is the only missing element. A new uptrend is looking to initiate which will at least provide us traders with a good swing trade opportunity.