Yesterday I was reading analyst reports on financial mainstream media websites about how the experts believe April CPI will show that inflation has peaked. April CPI came in at 8.3%, higher than the 8.1% expected. The majority of analysts had it wrong.
Some market participants believed that stock markets would tank on higher than expected inflation. So far, markets are holding up intraday early on.

My technical basis still remains bearish for stocks. The downtrend remains intact until it breaks above a key level. A pullback to this level is expected. You can check out my recent video on the technicals:
Let’s get back to inflation.
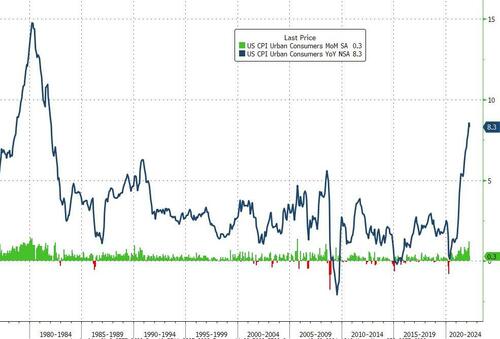
The Consumer Price Index came in at 8.3% for the month of April 2022, more than the 8.1% estimate. A slight ease from March’s 8.5% print but still near 40 year highs.
If we remove food and energy prices, core CPI rose 6.2%, higher than the 6% expectation. The month-over-month gains also were higher than expectations — 0.3% on headline CPI vs. the 0.2% estimate and a 0.6% increase for core, against the outlook for a 0.4% gain.
Housing prices add more worries. The shelter index, which makes up about one-third of the CPI weighting, increased another 0.5%, consistent with its rise over the previous two months, and was up 5.1% on a yearly basis, its fastest gain since April 1991.

Increases in the indexes for shelter, food, airline fares, and new vehicles were the largest contributors to the seasonally adjusted all items increase. The indexes for medical care, recreation, and household furnishings and operations also increased in April.
Zerohedge laid out some increases:
- The food at home index rose 10.8 percent over the last 12 months, the largest 12-month increase since the period ending November 1980.
- The index for meats, poultry, fish, and eggs increased 14.3 percent over the last year, the largest 12-month increase since the period ending May 1979
- The index for airline fares continued to rise sharply, increasing 18.6 percent in April, the largest 1 month increase since the inception of the series in 1963.
- The food index rose 0.9 percent over the month as the food at home index rose 1.0 percent. The energy index declined in April after rising in recent months. The index for gasoline fell 6.1 percent over the month, offsetting increases in the indexes for natural gas and electricity.
- The index for new vehicles increased 1.1 percent in April after rising 0.2 percent in March. The medical care index increased 0.4 percent in April.
- The index for hospital services rose 0.5 percent over the month, the index for physicians’ services rose 0.2 percent, and the index for prescription drugs was unchanged.
- The index for household furnishings and operations continued to increase, rising 0.4 percent in April after increasing 1.0 percent the prior month.
- The index for motor vehicle insurance increased 0.8 percent in April.
- Also rising over the month were the indexes for personal care (+0.4 percent), education (+0.2 percent), alcoholic beverages (+0.4 percent), and tobacco (+0.4 percent).
Did anything decline? Yes. Apparel, communication and used cars and trucks fell.
We even have some news today that might increase inflationary pressures on rising energy costs. Ukraine has halted some Russian gas flows to Europe. Europe will feel it, but we are seeing Natural Gas and Oil prices rise which will affect us too.
So what does this all mean for you and your money?
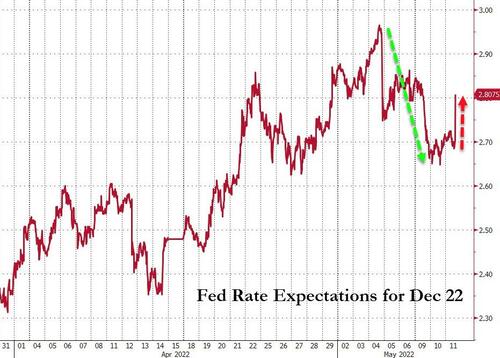
The Federal Reserve will remain super hawkish and rate hike expectations have increased.

Matt Maley, chief market strategist for Miller Tabak + Co., says: “Very simply, this high inflation number has dimmed the hopes for many investors considerably that we’ve reached peak inflation. Therefore, the Fed will remain hawkish and it just might put a 75 basis point hike back on the table.”
A few weeks ago, I explained the current market sell off. In that article, I explained why the Fed is trapped and has to choose to either tame inflation or keep assets propped. They will not be able to do both.
It seems to me that most of the mainstream media is referring to the non-monetary inflation. Inflation from shortages, supply chains and rising energy prices. However, I focus on the inflation from monetary inflation. There is too much money out there without an increase in productivity, hence creating a scenario where there is more money competing for the same, or less, number of goods and services. The Fed will need to get rid of this excess money, and the way to do so would be by reducing the balance sheet. They sell treasuries to banks, thereby removing money from the banks and the system. The Fed has said this will slowly begin in June. The big question is for how long? How long can they do this until something breaks in the real economy from rising rates and falling asset prices.
The recession watch is real too. If the US Q2 GDP comes in negative, the US is officially in a recession. The Fed would then need to pause or cut interest rates to get the economy going again. A recession might be welcomed as it would hit demand and cause inflationary pressures to lessen.

A couple of charts to note. First, the US 10 year yield. We hit major support at 3.23% and are now seeing some resistance here. To me, the markets have priced in all the rate hikes here. However, if the markets begin to factor in a 75 basis point rate hike, we could breakout above 3.23%.

The US Dollar confirmed a breakout yesterday, and today we are seeing a retest of the breakout zone. A more hawkish Fed would mean a stronger Dollar. I have written much about the forex markets recently. Expect some fireworks, and they are already beginning in Asia.

When we talk about higher interest rates, we need to watch the growth stocks. They tend to fall when interest rates are rising. The Nasdaq is still holding at my major support zone. A bottom and bounce is possible. I do like to see multiple days of range at support as it indicates the selling pressure has exhausted. If we close below this support zone and breakdown, then we expect a continuation of the downtrend.

