Gold and Silver are ripping after inflation data comes in higher than expected, resulting in some important technical triggers. It looks really good my Gold and Silver bulls (bugs)! As you will see in just a moment, the charts are hinting at much higher levels. In this Market Moment, I will focus more on Silver and we’ll take a look at two other miners I have been scoping. One large and one a bit smaller. Something for everybody.
But first, let’s talk about inflation. If you have been following my work, I have been warning about inflation since the pandemic monetary policy began. Keeping the economy shutdown prevented money velocity from moving. As someone who adheres to classical economic principles, this got me worried when we have a situation of people with more money competing for the same number of goods and services. The other aspect is what inflation really is: it is your currency weakening so it takes more of that weaker currency to buy something. Trust me, this part is going to get a whole lot crazier heading forward as it appears central banks are stuck. The currency war that I have written about in the past. Where central banks want a weak currency to boost exports and keep assets propped. Basically whoever raises rates first takes the hit as that nation’s currency will appreciate. Fun times ahead.
What is spooking people is not the fact that inflation is just rising, it is the PACE at which it is rising. We have never seen inflation rise like this. This is the fastest pace ever.
This is the CNBC headline:
U.S. consumer prices jump 6.2% in October, the biggest inflation surge in more than 30 years
Here are some data points:
- The consumer price index, which is a basket of products ranging from gasoline and health care to groceries and rents, rose 6.2% from a year ago. That compared with the 5.9% Dow Jones estimate.
- On a monthly basis, the CPI increased 0.9% against the 0.6% estimate.
- Stripping out volatile food and energy prices, so-called core CPI was up 0.6% against the estimate of 0.4%. Annual core inflation ran at a 4.6% pace, compared with the 4% expectation and the highest since November 1990.
- Fuel oil prices soared 12.3% for the month, part of a 59.1% increase over the past year. Energy prices overall rose 4.8% in October and are up 30% for the 12-month period.
- Used vehicle prices again were a big contributor, rising 2.5% on the month and 26.4% for the year. New vehicle prices were up 1.4% and 9.8%, respectively.
- Food prices also showed a sizeable bounce, up 0.9% and 5.3% respectively. Within the food category, meat, poultry, fish and eggs collectively rose 1.7% for the month and 11.9% year over year.
Big confidence crisis heading forward, and all eyes and ears will be on central banks. If inflation keeps rising at record pace, will analysts and the market start questioning the “transitory” inflation narrative? Could the Fed be wrong? To be honest, when we had the Fed meeting a few weeks ago, it was a quite bearish/dovish tapering announcement. Leading some contrarians to speculate that the Fed is terrified about tapering and rising rates. The Fed has given themselves some breathing space by saying inflation will continue until mid 2022. Let’s see how things progress.
If you think the Fed and other central banks are wrong, then you should be looking at anti fiat investments. I really like the commodities. They are cheap compared to everything else, and technically are hard assets. Pretty much every commodity is rising. For some, they are blaming supply chains, but that doesn’t apply to everything. To me, this is the inflation trade. Money is running into commodities.
When one thinks inflation hedge, the precious metals come first to mind. Gold, Silver and I would add Platinum and Palladium. The first two just have a monetary history going back thousands of years.
For us Gold and Silver bulls, things are just getting exciting!
I recorded this Youtube video on Monday. The same technicals I am going to show you are on that video. Take a look at what I was expecting versus how things played out.
Let’s start with Gold.

We have been bullish since the flag breakout. No momentum initially. This was because the breakout happened a few days before the big Fed announcement, so traders were waiting for that to pass before initiating positions. Gold initially fell on the Fed, but once the market took some time to digest the news, we shot up higher in the next few days. If you are a member of Equity Guru’s Discord Channel, I have been saying watch for the break above $1830. It is happening now, and the break is strong. Let’s see how this daily candle closes. If we get the close above $1830, then a move up to $1900 is coming.

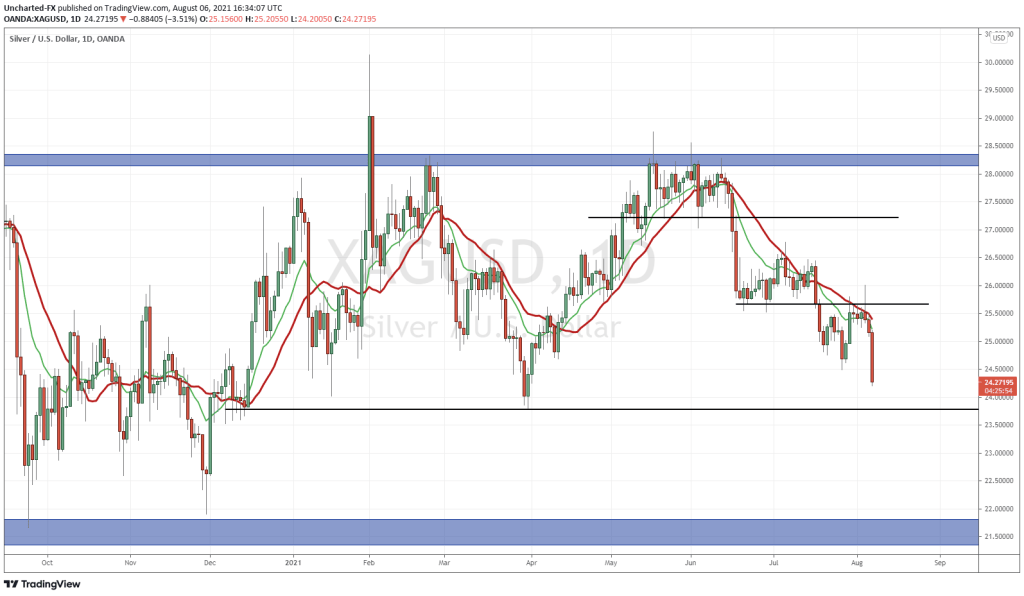
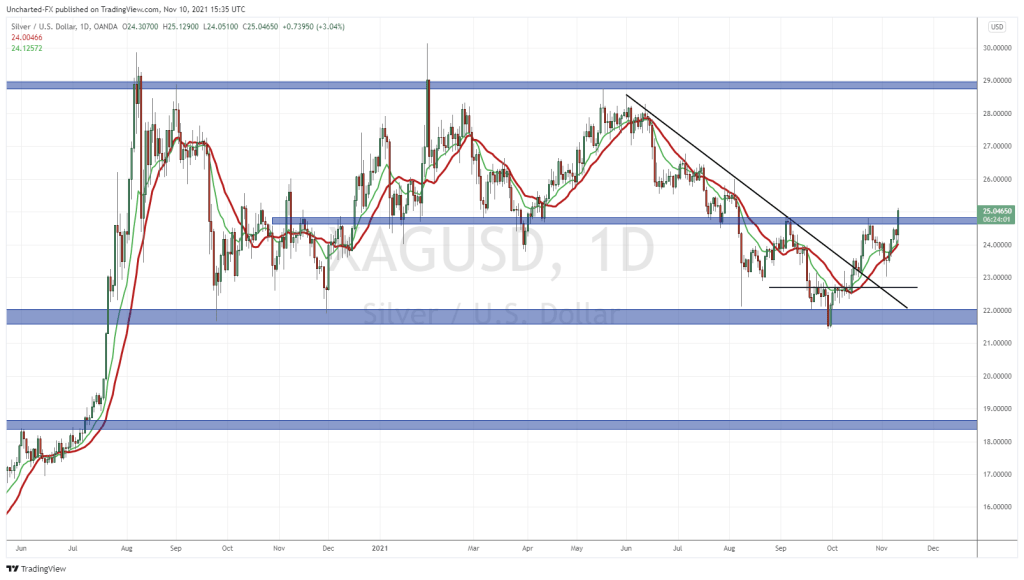
Take a look at this Silver bulls! Ever since Silver tested the major support zone of $22, which I told readers about, the chances of a new uptrend increased dramatically. The range break and the subsequent trendline break just confirmed a new uptrend. I have been expecting new recent highs to confirm the FIRST higher low in this new uptrend. More swings to come.
For those of you with technical eyes, do you see it? Yes, I am talking about the inverse head and shoulders pattern. The quintessential reversal pattern, and one which must print after a downtrend to be effective. This meets our criteria, and if Silver closes above $24.50 today, we are good to go! There is some interim resistance at $27, but I see Silver heading to $29 and higher if the inflation narrative plays out as I think it will. The apes over on Wall Street Bets Silver are probably going wild. Deep inside, I am too. Yes, I am an ape, or as WSB Silver puts it, a Silverback Gorilla.

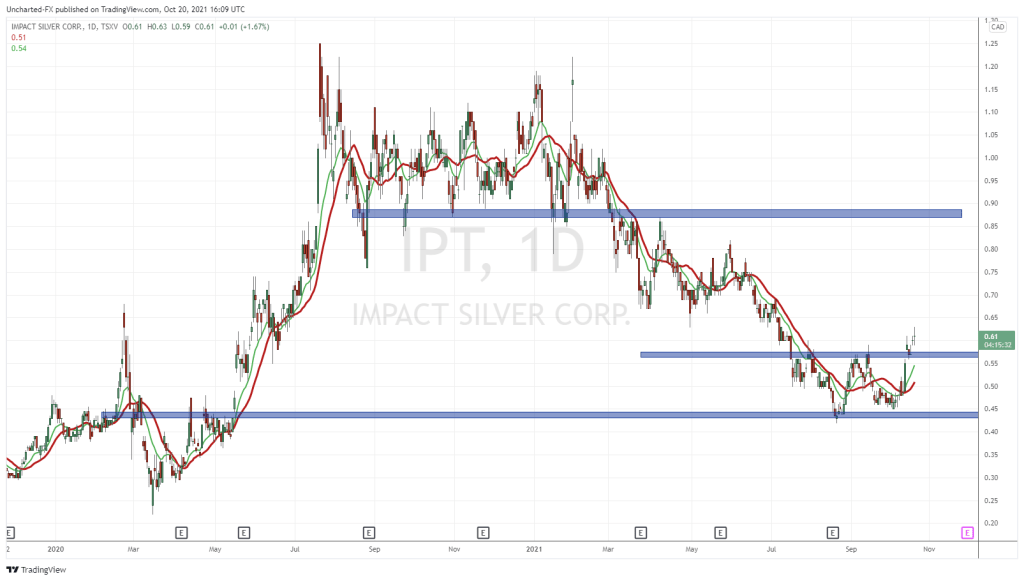
I promised a couple of miners. First is Impact Silver. Readers were given the heads up on the breakout on October 20th 2021, where I said Impact Silver has one of the best charts for Silver bulls! It still does. Playing out just as I wrote in that article. We remain bullish above $0.55, and have been expecting a higher low swing to develop. This can finally be confirmed with a daily close above these recent highs of $0.67. Let’s go!

The first Silver play many think of is First Majestic Silver. Traded on both the US and Canadian exchange. A big boy pure Silver miner. Do you see it? Yes, another inverse head and shoulders pattern. We got the breakout, and then yesterday saw the retest. Today with the spike as Silver moves higher. Notice I have drawn a resistance zone nearby at the $18.50 zone. It is a major flip zone, and all of us will feel much better knowing we have crossed above it. Let’s watch for this, as we remain bullish First Majestic above $16.50.
Big day for these Silver plays! Today’s daily candle closes could play a large part in setting up the moves for the rest of the year!