Aequus Pharmaceuticals(“AQS”) a specialty pharmaceutical company that develops and focuses on commercializing value-added products in specialty therapeutic areas in the Canadian market is today EG idea of the day. On a recent episode of “The Equity.Guru Investor Roundtable” I talked about the ‘secret sauce’ or the six filters that I use to quickly screen companies manually.
The first of these filters was obviously revenue growth followed by operating earnings or loss growth depending on the company. Next, I looked at ratios that account for debt in the business’ capital structure and their ability to generate cash from its day-to-day operations or better known in the investment space as cash flow from operations over a five-year period. Once I look at the operating cash flow growth I analyzed the share dilution from the issuance of common stock. Finally, we look at the return and invested capital which shows the ability of the management team to generate a return (income in excess of the financial costs of the sources of funds) from the equity and debt financing.
I use these filters as a starting point for analysis. the purpose of the filters is to address the problem of the over +10,000 publicly traded companies that you could analyze. having a system that allows you to filter through more companies gives you the ease of mind of only analyzing companies that you can understand or appreciate.
I thought it would be cool and useful to go over Aequus again and further explain what each filter tells me.
The 6 Filters
5-year Revenue Growth (“CAGR”): +30%
AQS sales force currently markets third-party or exclusively licensed products for which the firm receives sales based on agreed-upon percentages of net sales (if they act as an agent) and/or gross sales (if they are the principal).
AQS can increase its sales in a few ways. The first of these methods would be to increase the volume of the product sold through marketing campaigns or an increase in their sales force which would have an impact on sales and marketing expenses. The firm could also increase the price for their product to the end customers of their exclusively licensed products increasing the gross sales but could determine volume away from them as customers seek lower-priced products. the last avenue for growth would be acquisitions of other businesses in a similar market increasing the businesses total market share and reducing competition but this could draw down on their cash balances and need excessive time from their key management taking them away from their day-to-day activity as they tried to improve and integrate the two businesses operations.
Thus far sales have gone from $700,000 and 2016 two almost $2.6 million in 2020 which is a CAGR of 30% per annum. This increase in sales has also been accompanied by a decrease in the general and administrative expenses as well as a decrease in the research and development expenses improving the operating loss position.
5-year Operating Loss Reduction (“CAGR”): -31%
As mentioned in filter one the operating loss position for AQS has improved over time. this was mainly due to a 30% increase in these sales of the business, a 5.65% decrease in the operating expenses, and a further decrease of 47% on research and development costs.
The reduction in the operating expenses can be separated and analyzed through three different sections.
- The first is the company’s research and development cost where we would further focus on why the R&D has excessively decreased by 47% over the last three years. If you were to go into the company’s website, you would notice that majority of their product are in the commercialization phase, and they only have a few in preclinical or clinical trials. this progress through the development stage has allowed the business to reduce or manage its R&D and expend fewer resources. The majority of their sales also come from the promotion of third-party products meaning the bulk of the expenses are with the counterparty.
- The second pillar in the operating expenses would be their sales and marketing expenses. If the business is pipeline is working at full capacity the business might not need to use more cash for sales or marketing and utilize its current Salesforce and marketing department. This gives them the ability to manage their sales force according to the cyclicality of the sales. For the six months ended June 30, 2021, the bulk of the expenses, $600,000, was for the sales force and $90,000 for advertising and promotions.
- The last prong of this Trident would be their general and administrative expenses which incorporates all other corporate-level overhead. this section is also large for the company and includes costs such as consulting fees, depreciation of right to use assets, interest expenses, management-related wages and benefits, and legal fees.
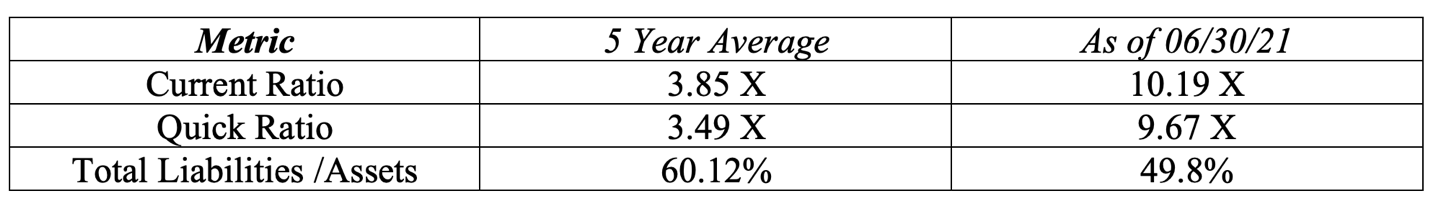
Quick Assets over Liabilities (“Current Ratio, Quick Ratio, Total Liabilities /Assets”)
All said and done the company could be doing exceptionally well with its sales force and its cost management but could have a burden of liabilities on its balance sheets forcing it to pay copious amounts of cash and interest in principle payments to debt and bondholders.
To assess its ability as a going concern and its ability to pay its loans and other short-term liabilities. We can look at the current ratio and quick ratio that indicate how much they have in cash and other short-term financial assets to cover their short-term liabilities.
On average over the last five years, the companies have had a current ratio of 3.85 meaning they had 3 times more short-term assets to cover their short-term liabilities. They had 3.5 times the cash and receivables over their current liabilities. As of 06/30/21, they had more liquidity due to recent financing (they raised $5million from stock in the last twelve months) and their current and quick ratios improved to 10 and 9 times respectively.
They also have a more conservative capital structure than before with 60% of the total assets coming from their liabilities and 40% from equity. As of 06/30/21, the equity component is now 51% and the liabilities are 49% of the capital structure. It should be noted that the company had $2.12 million in total debt compared to the total liabilities of $2.41 million.
From this simple analysis, it seems the company does have enough cash and financial assets to cover its short-term liabilities. but with time we would hope that they use cash from operations instead of issuing common stock and bonds or bank financing.
5-year Cash flow from (used) in Operations Growth (“CAGR”): (-29.11%)
Cash flow from operations is the beginning figure that we use to calculate the free cash that can be taken out of the business without interrupting its day-to-day operations and its intrinsic value over time. This free cash can be used to (i) pay of debt, (ii) repurchase stock, (iii) use it for capital expenditures, or (iv) pay dividends to the shareholders.
Since AQS still has a negative operating cash flow it will need to finance most of its operations from the sale of stock and the issuance of bonds and other types of loans. But it’s good to see that earnings losses are decreasing, and the cash being used by the firm is following the same trend. This sort of trend indicates a firm that is getting closer and closer to breaking even. The negative cash position has decreased by 29%.
5-year Share Dilution (+) or Accretion (-): +14%
As I mentioned before the company will probably issue a lot of stock and bonds defined its operations as it works towards breaking even. There is not much else to say here but we would hope the pace of dilution would reduce. a lot of people ignore this element and say that the issuance of common stock gives the company cash to invest in profitable ventures. But if the firm has been investing at negative returns and earnings increase by 20% and the share dilution also increases by 20% your net position will be the same ownership when you’re comparing the two EPSs.
5-year Return on Invested Capital (“ROIC”): -187%
The ROIC ratio gives a sense of how well a company is using the money it has raised externally to generate returns. Equating a company’s return on invested capital with its weighted average cost of capital (WACC) reveals whether invested capital is being used efficiently.
The average ROIC for AQS is -187%, and the current ROIC over the last twelve months was negative 28%. To calculate the WACC we need to get the cost of equity and the after-tax cost of debt. In 1996 Myers and ShyamSunder found that 7 Small pharma & biotech firms (during 19984-1988) had an average nominal WACC of 19.1% and in 2007 Golec & Vernon found the average to be around 16.2%. So, the average cost for AQS could be between 17% to 20% and they have a current return of negative 28%. As of the latest report, their operations have ‘destroyed’ -45% or -48% in value. But the trend is positive as can be seen from the graph below
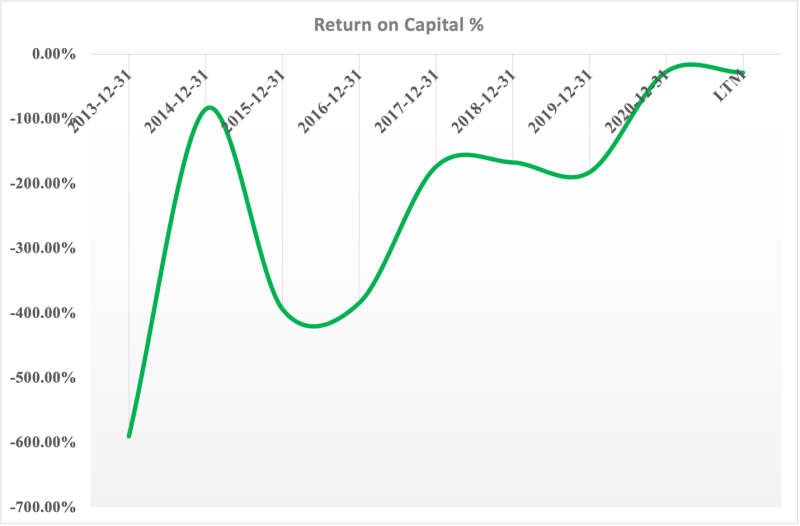
With time as the business continues to put its workforce to work, manage its corporate costs, manage its balance sheet, and strive to break even the cost of capital will reduce, and the firm will hopefully start creating value for its shareholders.
Using the 6 filters I feel AQS is a company I could dedicate more time to analyze and see if any of my assumptions will be realized. This is a great starting point.